by April Markiewicz

The above photo depicts Lake Whatcom on a late summer evening at sunset in Sudden Valley. photo: EJ Ledet
“Something is going on.” That is the phrase being used behind the scenes to describe some of the latest data in the Lake Whatcom Monitoring Project 2017/2018 Report by Matthews et al. (2019). Lake Whatcom (for those newcomers to our area who may not be aware) is the primary drinking water source for about 100,000 residents in Bellingham and Whatcom County.
Since the 1960s, annual monitoring of its water quality has been conducted with samples collected from each of the three basins of the lake (see map). Those data have provided an invaluable record of the lake’s decline, as well as helped our community identify and implement actions to slow and, hopefully, reverse that decline.
At first glance, the 2017/2018 water quality data for several parameters are consistent with previous years’ (except for those years that had summer temperature extremes). Chlorophyll concentrations (see Figure 1 ), as well as green algae (Chlorophyta) (see Figure 2) and blue-green bacteria (cyanobacteria) numbers (see Figure 3) seem to have stabilized according to Matthews et al. (2019). Even total phosphorus concentrations, though variable, appear to have leveled off or even declined in each of Lake Whatcom’s basins (see Figure 4).
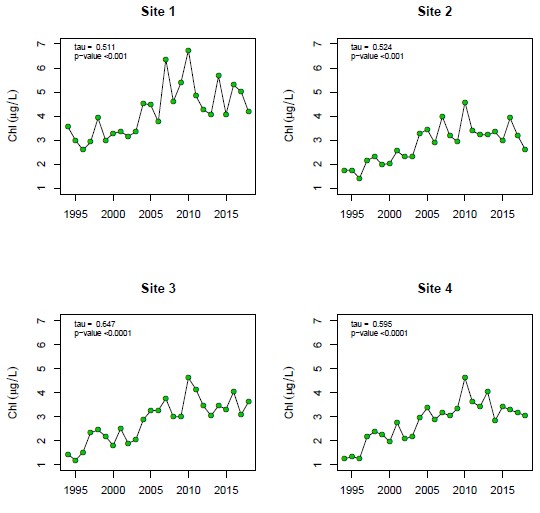
Figure 1. Median summer near-surface chlorophyll concentrations (June – October) at each sampling site from 1994 – 2018 (Matthews et al., 2019).

Figure 2. Median summer near-surface green algae (Chlorophyta) counts from June through October all sites and depths (1994 – 2018) (Matthews et al., 2019).
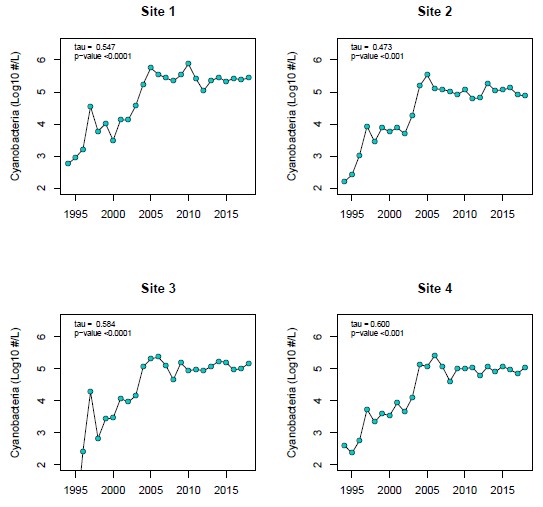
Figure 3. Log10 plots of median summer near surface cyanobacteria counts (June – October) from 1994 – 2018 (Matthews et al., 2019).
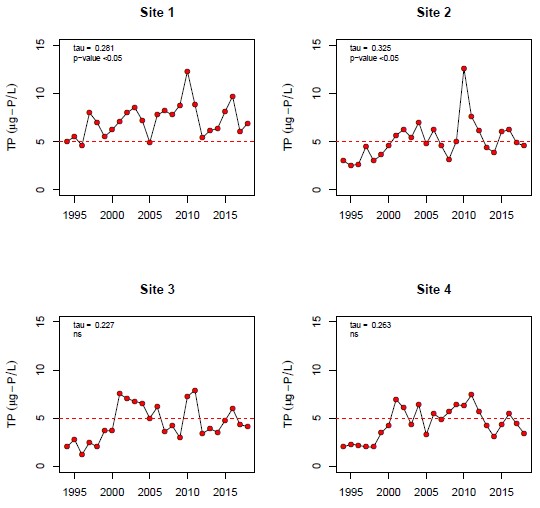
Figure 4. Median summer near-surface total phosphorus concentrations over time at each sampling site from 1994 – 2018 (Matthews et al., 2019).
The outlier that is causing the concern is the concentration of dissolved inorganic nitrogen (DIN) which has been decreasing in each basin since at least 1994 (see Figure 5).
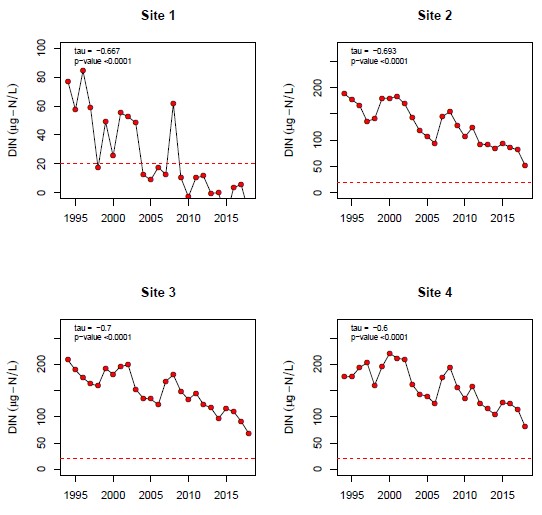
Figure 5. Minimum summer near-surface dissolved inorganic nitrogen (DIN) concentrations over time at each sampling site from 1994 – 2018 (Matthews et al., 2019).
What Is DIN and Why Is It Important?
As anyone who has ever gardened knows, nitrogen is a key nutrient, like phosphorus, that is crucial for plants’, including algae and bacterial, growth. In its dissolved inorganic form (DIN), it is mainly present in lakes as nitrate, ammonium, dissolved nitrogen gas, and nitrite concentrations. DIN is of interest in the study of lake productivity because it is the most bioavailable form for algae and bacteria to assimilate for growth.
As a lake becomes more productive (eutrophic), the processes of nitrogen assimilation by these species in the upper water layer, as well as denitrification by bacteria in the thermally stratified bottom layer, intensifies. The end result is low concentrations of DIN in the upper water layer during the biologically productive summer months, but very high ammonium concentrations in the unoxygenated bottom layer (just like what is happening in Lake Whatcom).
DIN is, therefore, a good measure of phytoplankton productivity, as well as an indicator of a lake’s trophic state (Wetzel, 2001).
The Process and Consequences
How it works is, during the spring and summer months algae and bacteria are assimilating both DIN and phosphorus from the water column for growth. Diatoms and green algae are the dominate species in the phytoplankton. As DIN is removed from the water column, those species, like green algae that cannot find other sources of DIN, will stop growing and are replaced by less desirable ones that can.
Blue-green bacteria (cyanobacteria) are one of those few groups of microorganisms that can utilize other sources of DIN. They do so by converting nitrogen gas from the atmosphere or dissolved in the water into organic nitrogen (e.g., ammonium, nitrate) using specialized cells called heterocysts.
As DIN continues to decline over the summer and fall, cyanobacteria produce more heterocysts that help to supplement their nitrogen requirements (Li et al., 2018, Wetzel, 2001, Woods et al., 2010). As a result, cyanobacteria proliferation is dramatically enhanced, and, by late summer, blooms are common, whereas other algae and phytoplankton species have declined (Li et al., 2018, Smith et al. 1995, Woods et al., 2010). Another consequence of this process is that these conditions are also favorable for the introduction and establishment of toxic forms of cyanobacteria (Li et al., 2018).
Cyanobacteria Proliferation
Cyanobacteria are considered one of the most critical concerns for drinking water supplies (Li et al. 2018). They cause odor and taste problems in tap water, clog water filtration and treatment systems, form huge decomposing mats on the surface of the lake, and produce toxins that can harm wildlife, waterfowl, pets, and humans
According to the World Health Organization (WHO, 2019), the toxins produced by certain species of cyanobacteria can target the liver or kidney, whereas others target the nervous system or gastrointestinal tract. Symptoms can range from general nausea to those requiring intensive hospital care and even death.
What’s Happening in Lake Whatcom
In Lake Whatcom, inputs of nitrogen and phosphorus from the surrounding watershed have resulted in accelerated growth of algae and bacteria over the years (see Figures 1-4). Concurrently, there has been a corresponding and progressive decline in DIN present in the water columns of each basin over the years (see Figure 5 on next page).
Conditions are now favorable for not only more cyanobacteria blooms to occur and cause additional water treatment issues, but also to facilitate the introduction and establishment of harmful cyanobacteria in the lake.
As such, the city of Bellingham now includes taxonomic analysis of the phytoplankton for toxic species of cyanobacteria as part of the annual monitoring project conducted by Matthews et al (Dr. Robin Matthews, personal communication, 2019). Fortunately, no such species have been found to date.
What the Data Show
The most recent Lake Whatcom DIN data, therefore, indicate that water quality is continuing to decline in Lake Whatcom and that conditions are favorable for the growth and proliferation of noxious cyanobacteria. What is surprising is that the other water quality data for algal biomass and phosphorus seem to indicate that the decline in water quality has slowed considerably, if not stabilized. Hence, the comment that “something is going on.”
Key points from the 2017-2018 Lake Whatcom Monitoring Report are as follows:
• Indications of continued eutrophication (increased biological productivity) in Lake Whatcom persists.
• Chlorophyll (Chl) concentrations are trending up (increasing) in all three basins (see Figure 1), though Matthews et al. (2019) state they appear to have stabilized.

Figure 1. Median summer near-surface chlorophyll concentrations (June – October) at each sampling site from 1994 – 2018 (Matthews et al., 2019).
• Green algae (Chlorophyta) counts in general are continuing to increase (see Figure 2)

Figure 2. Median summer near-surface green algae (Chlorophyta) counts from June through October all sites and depths (1994 – 2018) (Matthews et al., 2019).
• Blue-green bacteria (cyanobacteria) populations are trending up (increasing) in basin 1 and the north area of basin 3 (see Figure 3).

Figure 3. Log10 plots of median summer near surface cyanobacteria counts (June – October) from 1994 – 2018 (Matthews et al., 2019).
• Total phosphorus (TP) concentrations are still trending up in basins 1 and 2 (see Figure 4).

Figure 4. Median summer near-surface total phosphorus concentrations over time at each sampling site from 1994 – 2018 (Matthews et al., 2019).
• Dissolved inorganic nitrogen (DIN) concentrations continue to decline in all three basins (see Figure 5). Since 2009, there has been no DIN in basin 1.

Figure 5. Minimum summer near-surface dissolved inorganic nitrogen (DIN) concentrations over time at each sampling site from 1994 – 2018 (Matthews et al., 2019).
• Due to cooler spring temperatures, the rate of dissolved oxygen (DO) loss from the bottom waters of basins 1, 2 and 3 was slower, but, by August, levels were within historical ranges
• As a result, DO concentrations at 14 meters deep in basin 1 in July were higher; however, concentrations continue to trend downward (see Figure 6).

Figure 6. Trends in dissolved oxygen over time in basin 1 at 14 meters (~46 feet) sampled in July and August from 1988 through 2018 (Matthews et al., 2019).
• Total trihalomethanes (TTHMs), created during the disinfection process of water treatment, continue to decrease in tap water.
What Does It All Mean?
Li et al. (2018) warn that cyanobacteria blooms are predicted to become even more common due to climate warming. Warmer temperatures stimulate biological productivity in waterbodies. Lakes thermally stratify earlier and the stratification persists longer. Those conditions accelerate the assimilation of DIN from the water column and consumption of dissolved oxygen from the deeper water layers. The results are deleterious cyanobacteria blooms in the upper oxygenated water column and extensive unoxygenated “dead zones” in deeper water layers.
Controlling nutrient inputs into Lake Whatcom is the obvious solution to reducing algal and bacterial growth, and thereby reducing associated adverse effects on species compositions, community structure, and water chemistry. Since phosphorus is the key nutrient in the growth of algal and cyanobacteria biomass, actions by the Lake Whatcom Management Team have prioritized reducing inputs into the lake. By reducing phytoplankton growth, consumption of DIN is reduced and conditions favoring harmful cyanobacteria blooms are prevented.
According to the 2018 Lake Whatcom Management Program Progress Report (LWICT, 2019), 436 pounds of phosphorus per year that would have entered the lake through stormwater runoff has been prevented. The Homeowner Incentive Program (HIP), pollution source control, Best Management Practices (BMPs), and construction of stormwater treatment facilities have been responsible for the reductions. Moreover, an additional 15 pounds per year were removed by installing new stormwater treatment facilities, as well as retrofitting existing ones.
This year, the city of Bellingham will complete the last three stormwater treatment facilities in the city’s jurisdictional area of the watershed. The county and Lake Whatcom Water and Sewer district will also continue their efforts to reduce phosphorus loadings to the lake from their respective jurisdictional areas.
The goal is to meet the Total Daily Maximum Load for phosphorus set by the Washington Department of Ecology, which will require preventing 3,150 pounds of phosphorus from entering the lake (Hood, 2016). The target date to meet this daunting goal is 2066.
As our community is seeing firsthand, the price to clean up our drinking water source, as well as improve the taste of our tap water is starting to add up. Implementing stormwater treatment improvements in 2018 alone cost us $1,062,000. The installation of the water pretreatment facility using the Dissolved Air Floatation process that was finished last fall cost an estimated $15,000,000.
Even if all measures were implemented now to prevent any further inputs of nutrients into the lake, water quality would continue to decline for years, if not decades. Stabilizing water quality and preserving our community’s drinking water source is going to be a long-term and very costly process, but it is the price we have to pay for continuing to allow people to live in the watershed.
At least, with the implementation of a Stormwater District that encompasses all residents in the entire watershed, those people will pay a larger share of the cleanup costs. It’s a step that has taken decades to implement and required changes in our community’s political, as well as social values. We’re taking the right steps to reverse the misdeeds of the past, but the question remains as to whether we can implement the changes needed in time to save our drinking water source for future generations.
References
• Hood, S. 2016. “Lake Whatcom Watershed Total Phosphorus and Bacteria Total Maximum Daily Loads: Volume 2.” Water Quality Improvement Report and Implementation Strategy. Washington Department of Ecology Publication No. 13-10-012. Accessed 04/04/2019 at https://fortress.wa.gov/ecy/publications/summarypages/1310012.html.
• LWICT (Lake Whatcom Interjurisdictional Coordinating Team). 2019. 2018 Lake Whatcom Management Program Progress Report. Accessed 04/04/2019 at http://www.lakewhatcom.whatcomcounty.org/lwmp_2018_progress_report.pdf.
• Li, J., L-A Hansson, and K.M. Persson. 2018. “Nutrient control to prevent the occurrence of cyanobacteria blooms in a eutrophic lake in southern Sweden, used for drinking water supply.” Water 10 (7):919-930.
• Matthews, R.A., M. Hilles, J. Pickens, R. Mitchell, J. Robert, and G.B. Matthews. Lake Whatcom Monitoring Project 2017/2018 Report (2019). Lake Whatcom Annual Reports. 27. Accessible at: https://cedar.wwu.edu/lakewhat_annualreps/27.
• Smith, VH, V.J Bierman, B.L. Jones. 1995. “Historical trends in the Lake Okeechobee ecosystem IV. Nitrogen:phosphorus ratios, cyanobacterial dominance, and nitrogen fixation potential.” Arch. Hydrobiol. 107:71-88.
• Wetzel, R.G. 2001. Chapter 12 The Nitrogen Cycle in Limnology: Lake and River Ecosystems, Third Edition. Academic Press, San Diego, CA., pages 205-237.
• Wood, S.A., J. M.J. Prentice, K. Smith, and D.P. Hamilton. 2010. “Low dissolved inorganic nitrogen and increased heterocyte frequency: precursors to Anabaena planktonica blooms in a temperate, eutrophic reservoir.” Journal of Plankton Research, 32 (9):1315–1325, https://doi.org/10.1093/plankt/fbq048.
• World Health Organization (WHO). 2019. “Water-related diseases: Cyanobacterial Toxins.” Accessed 04/01/2019 at https://www.who.int/water_sanitation_health/diseases-risks/diseases/Cyanobacteria/en/.
_________________________________
April Markiewicz is a toxicologist and the associate director at the Institute of Environmental Toxicology at Huxley College of the Environment at Western Washington University, as well as president of the People for Lake Whatcom Coalition.


