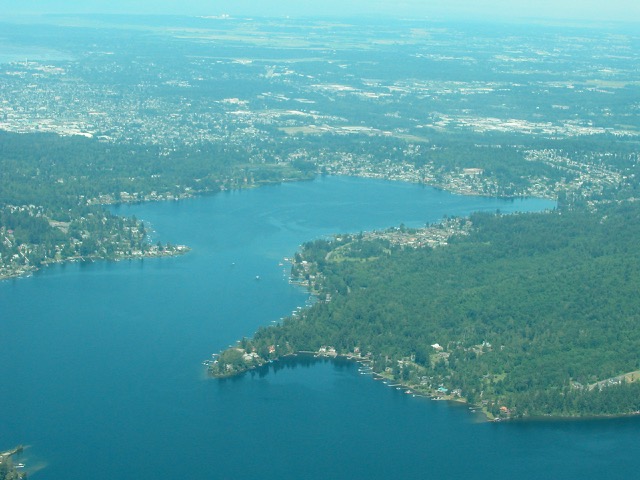
Lake Whatcom North Basin photo: April Markiewicz
A Matter of Priorities
The take-home message in the latest Lake Whatcom Monitoring Report is that our community’s primary drinking water source is continuing to decline (Matthews et al. 2020). The good news is we are supposedly on track to have it fixed by 2066, a mere 46 years from now. Our community’s success will hinge on whether we can continue to make progress in complying with the Washington Department of Ecology’s (Ecology) Total Maximum Daily Load (TMDL) for phosphorus in Lake Whatcom.
For those of you new to our community, Lake Whatcom provides drinking water to about 100,000 residents in Whatcom County, including all of Bellingham. Just head east on Lakeway Drive in Bellingham, and, once you crest the final hill at The Firs, you will see the breathtaking view of the lake. Depending on the time of year, you will also see motorboats, jet skis, kayaks, and other forms of recreation taking place on the lake. You will also be impressed by the beautiful homes surrounding much of the shoreline and watershed.
Once you reach the waterfront, basin 1 will be to your left; basin 2 will be in front of you and basin 3 will be farther south. Each basin is separated by an underwater sill created by the actions of glaciers as they retreated from the region 10,000 years ago. Basin 1 is about 100 feet deep; basin 2 is about 80 feet deep, and basin 3 is about 350 feet deep. Basins 1 and 2 each hold about 2 percent of the lake’s water, whereas basin 3 holds 96 percent (see Lake Whatcom map). There are 7,123 homes in the watershed (mostly around basins 1 and 2) and there is room for 1,563 more (City of Bellingham 2019). Needless to say, for a drinking water source, Lake Whatcom has been heavily impacted by historical, as well as current human actions and activities in its watershed.
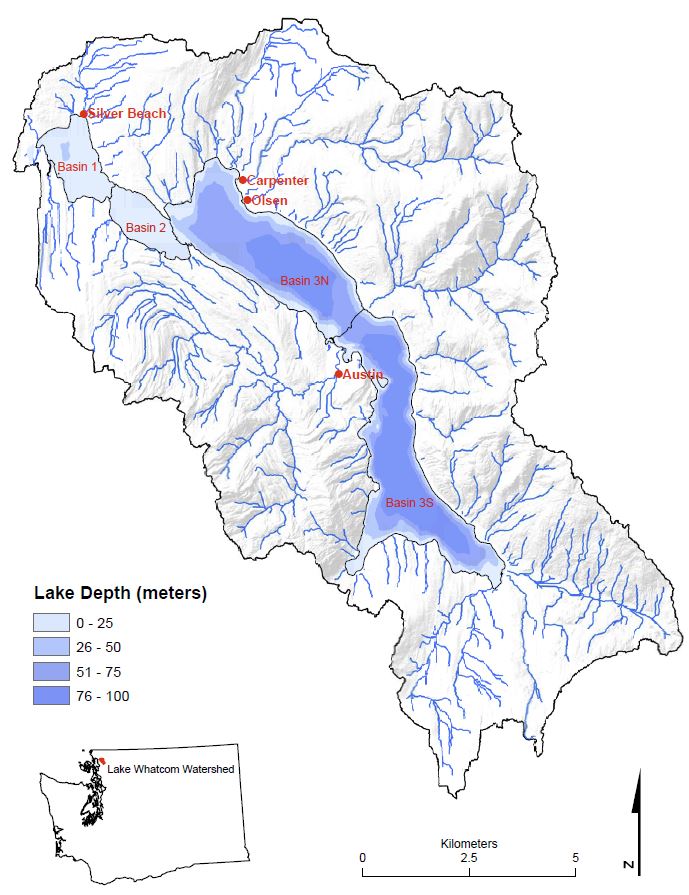
Lake Whatcom watershed and sub-basins (Matthews et al., 2019).
In 1998, the lake was listed as impaired under section 303(d) of the Clean Water Act. The TMDL study was conducted in 2008 and updated in 2016 to identify the main driver(s) causing the deteriorating water quality in the lake. It also provided guidance on actions required to stop the degradation and restore the lake to meet federal and state water quality criteria.
The TMDL identified phosphorus loading from urban development in the surrounding watershed as the cause of low dissolved oxygen (DO) levels in the lake (Hood 2016). Stormwater runoff was transporting the phosphorus into the lake, causing excessive plant, algal, and bacterial growth that consumed the DO. In turn, low DO caused chemical reactions that affected other water quality criteria, as well as harmed the aquatic organisms.
The TMDL mandated that 87 percent of phosphorus in the stormwater runoff had to be removed to match runoff conditions from forested lands (Hood 2016). It also recommended four options to achieve that goal: 1) provide storage during storms so that infiltration can take place in-between storms, 2) harvest rainwater for other uses, 3) decrease impervious surfaces, such as roofs, driveways, and roads in the watershed, and 4) reduce concentration of phosphorus in stormwater through source control and treatment. We were then given 50 years to reach that TMDL target.
Assumptions
Four years have passed since the TMDL requirements took effect. The question becomes whether we should just continue with “business as usual” and “keep making progress” for the next 46 years or should we prioritize “fixing” the lake as soon as possible. There are advantages and challenges with both approaches.
The benefits of using the current approach are that progress is slowly being made using the funding, staff, and resources currently available. To be successful, the “keep making progress” approach over the next 46 years makes several assumptions:
1. The lake will not undergo natural aging processes during that time interval. All lakes “age.” They fill in over geologic time with materials being transported into them from erosion in their watersheds, from atmospheric deposition, and from processes within the lake itself. These physical, biological, and chemical materials contain nutrients (phosphorus, nitrogen, and carbon) that result in a natural increase in biological productivity within the lake over time (DES 2019).
2. Reductions in phosphorus loadings into the lake each year will reach the target goal by 2066. The target is an 87 percent (3,150 pounds) reduction in phosphorus loading per year into the lake; however, only a 14.8 percent (467 pounds) reduction has been achieved as of 2018 (LWICT 2020a), leaving 72 percent (2,683 pounds) still to be removed over the next 46 years. On average that means 58 pounds of additional phosphorus must be removed each year from stormwater runoff entering the lake.
According to the Draft Lake Whatcom Management 2020-2024 Work Plan (LWICT 2020a), it took five years to achieve a cumulative reduction of 62 pounds of phosphorus from entering the lake, not one year. Moreover, of that amount, 31 pounds of phosphorus were reduced from 2018 to 2019, the highest reduction in one year to date (LWICT 2020a). At a rate of reducing phosphorus loading by 31 pounds/year, it would take 86.5 years (2,683 pounds/31 years) to achieve this target, well beyond the 50-year timeframe set by Ecology.
3. The rate of reducing additional phosphorus loadings into the lake will be constant or even improve over the next 46 years. According to staff responses to public comments on the Draft Lake Whatcom Management 2020-2024 Work Plan (LWICT 2020b), a multifaceted approach to reducing phosphorus is being implemented. It includes using stormwater treatment facilities, Best Management Practices (BMPs) for any construction in the watershed, and supporting the Homeowner Incentive Program (HIP) to get more volunteers to participate (LWICT 2020b). They also stated, “Both jurisdictions anticipate an acceleration in the amount of phosphorus that is removed over time and are firmly committed to meeting the overall phosphorus reduction goals within the required timeline and sooner if possible (LWICT 2020b).”
However, many of us still recall the early days when stormwater treatment facilities (ponds, vaults) were first constructed in the watershed. They were assumed to be removing phosphorus; however, months and, in some cases, years later when samples were finally collected and analyzed, it was discovered they were actually contributing more phosphorus into the lake, not less. As new approaches and technologies are tried, there may be setbacks or even failures that can delay progress toward attaining the TMDL target for years.
Even the Homeowner Incentive Program (HIP) that was started in 2011 as a five-year pilot program had to be revised. More public outreach, training, staff support, and funds had to be implemented to achieve greater participation and gains in phosphorus reductions. By the end of 2018, 177 properties were being retrofitted to reduce 28 pounds of phosphorus loading per year into the lake (LWICT 2019). Of the 177 properties, 64 volunteers participated in 2018, reflecting the success of the revised approach with homeowners in the watershed in just one year.
Currently, the Homeowner Incentive Program is voluntary; however, to achieve the TMDL target, most, if not all, homeowners may have to participate. The legal challenges to getting full compliance, as will providing the level of training, funding, and staff assistance to make a watershed-wide program successful, could delay progress for years. Given the challenges, it is difficult to imagine that phosphorus removal will accelerate in future years.
4. New and retrofitted developments in the watershed have zero phosphorus in their stormwater runoff into the lake. There have been no data collected at new developments or retrofitted properties to confirm zero phosphorus runoff. Even if analyses confirm zero phosphorus in the runoff entering the lake from these properties, future homeowners may alter their landscaping and property in such a manner that phosphorus is re-released.
5. Climate change, including warmer air and water temperatures, as well as changing weather patterns over the next 46 years, will not exacerbate water quality degradation in the lake. Lake Whatcom water quality data from extremely warm summers in 2003-2005 and 2014-2016 clearly showed the effects of higher seasonal temperatures on biological productivity in the lake. As warmer seasons become more frequent, adverse temperature effects on the biota and water quality will only increase.
Forty-six years from now is a long, long way off and any number of unforeseen events can derail our community’s efforts to reach the TMDL target. Priorities may change as a result of other pressing issues like the presence of toxic bluegreen bacteria or invasive species in the lake that may take precedence. Resources and funding to address those issues would siphon away those needed for addressing phosphorus loadings to the lake. One thing is certain though, there will be an entirely new cohort of city and county staff, contractors, and elected officials working to achieve that target. Will the same regulations, values, and political be in place to drive their efforts?
The other alternative is to prioritize the rate at which we reach the TMDL target to within a 10- or 15-year horizon. The benefits are that we would significantly decrease the current rate of water quality degradation in the lake and keep biological productivity at current levels. The fact that we would be preventing 1,000 to 2,000 pounds of phosphorus from entering the lake each year afterwards would stop the decline in water quality and accelerate the lake’s ability to stabilize. It will also dramatically slow down the aging processes in the lake by greatly reducing a much larger percentage of particle and nutrient loadings into it that otherwise would have continued for the next four decades with the current approach.
Prioritizing the completion of the TMDL will help ensure Lake Whatcom continues as our community’s high-quality drinking water source for generations to come. The challenge is obtaining a strong community commitment to make the huge investment of effort, resources, and money in the short term. Federal, state, and local grants, loans, and partnerships will be needed.
What the Current Data Show
The need for action now to achieve the TMDL goals sooner is because the lake’s water quality is continuing to degrade and not complying with federal water quality standards. According to the 2018/2019 Lake Whatcom Monitoring Report, several of the water quality parameters and algal data are within historical ranges; however, some do show trends of continued decline. Specifically, chlorophyll concentrations (see Figure 1), as well as green algae (Chlorophyta) (see Figure 2) and bluegreen bacteria (Cyanobacteria) numbers (see Figure 3) have increased. The growth of the algae indicate that nutrients are continuing to enter the lake and promoting increased biological productivity.

Figure 1. Median summer near-surface chlorophyll concentrations (June – October) at each sampling site from 1994 – 2019 (Matthews et al., 2020).
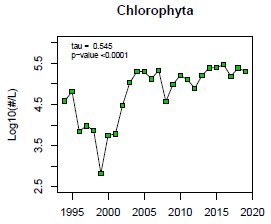
Figure 2. Log10 plots of median summer near-surface green algae (Chlorophyta) counts from June through October all sites and depths (1994 – 2019) (Matthews et al., 2020).
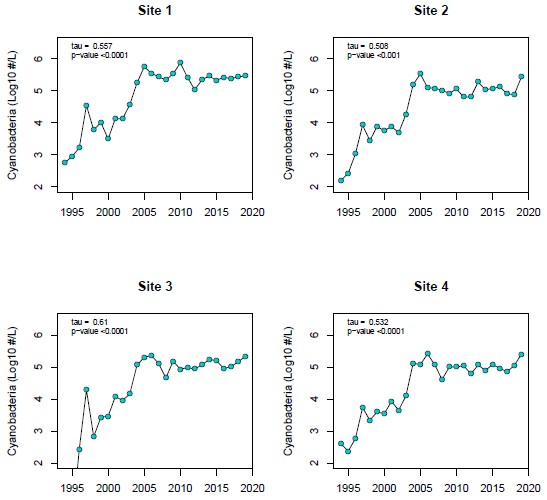
Figure 3. Log10 plots of median summer near-surface Cyanobacteria counts (June – October) from 1994 – 2019 ((Matthews et al., 2020).
The total phosphorus data (see Figure 4) provide evidence that despite ongoing efforts by the city of Bellingham, Whatcom County, and the Lake Whatcom Water and Sewer District, it is continuing to gradually increase in basin 3, though it does appear to have leveled off or declined in basins 1 and 2. That could be because of the focus on installing stormwater treatment facilities and ramping up HIP efforts in those two basins’ watersheds that have the highest development. Basin 3’s watershed, however, appears to be contributing more phosphorus into the lake.
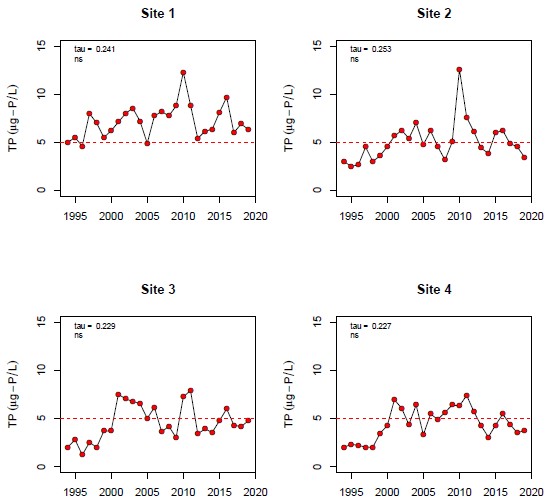
Figure 4. Median summer near-surface total phosphorus concentrations over time at each sampling site from 1994 – 2019 (Matthews et al., 2020).
The other crucial nutrient being monitored in the lake is dissolved inorganic nitrogen (DIN) and it is continuing to decrease in all basins, as it has since at least 1994 (see Figure 5). Algae consume DIN along with phosphorus from the water column and use those nutrients to grow. As DIN is removed from the water column, those species, like green algae that cannot find other sources of DIN, will stop growing and are replaced by less desirable ones that can. Bluegreen bacteria (Cyanobacteria) are one of those few groups of microorganisms that can utilize other sources of DIN.

Figure 5. Minimum summer near-surface dissolved inorganic nitrogen (DIN) concentrations over time at each sampling site from 1994 – 2019 (Matthews et al., 2020).
Cyanobacteria are considered one of the most critical concerns for drinking water supplies (Li et al. 2018). They cause odor and taste problems in tap water, clog water filtration and treatment systems, form huge decomposing mats on the surface of the lake, and produce toxins that can harm wildlife, waterfowl, pets, and humans. The city of Bellingham now analyzes the lake water for chemical markers that indicate the presence of toxic forms of Cyanobacteria. They also have the algal samples analyzed for the toxic species. To date, none has been found, but given current water quality conditions, it may be just a matter of time.
The take-home story is that even if all measures were implemented now to prevent any further inputs of nutrients into the lake, water quality would continue to decline for years if not decades. Stabilizing water quality and preserving our community’s drinking water source sooner rather than later must be a priority. Business as usual is only going to see the lake deteriorate even more, and be even more costly to protect and restore over the long-term. We are taking the right steps to reverse the misdeeds of the past, but the question remains as to whether we want to prioritize implementing the changes needed in time to save our drinking water source for future generations.
References
• COB (City of Bellingham). 2019. Lake Whatcom Watershed Annual Build-Out Analysis Report 2019. City of Bellingham Planning and Community Development Department. 8pp. http://www.lakewhatcom.whatcomcounty.org/LWWS_REPORT_2019.pdf. Accessed 04/24/2020.
• DES (New Hampshire Department of Environmental Services). 2019. Lake Eutrophication. 2 pp. https://www.des.nh.gov/organization/commissioner/pip/factsheets/bb/documents/bb-3.pdf. Accessed 04/27/2020.
• Hood, S. 2016. Lake Whatcom Watershed Total Phosphorus and Bacteria Total Maximum Daily Loads: Volume 2. Water Quality Improvement Report and Implementation Strategy. Water Quality Program, Washington Department of Ecology, Publication No. 13-10-012. Accessed 04/04/2019 at https://fortress.wa.gov/ecy/publications/summarypages/1310012.html.
• Li, J., L-A Hansson, and K.M. Persson. 2018. Nutrient control to prevent the occurrence of Cyanobacteria blooms in a eutrophic lake in southern Sweden, used for drinking water supply. Water 10 (7):919-930.
• LWICT (Lake Whatcom Interjurisdictional Coordinating Team). 2019. 2018 Lake Whatcom Management Program Progress Report. Accessed 04/04/2019 at http://www.lakewhatcom.whatcomcounty.org/lwmp_2018_progress_report.pdf.
• LWICT (Lake Whatcom Interjurisdictional Coordinating Team). 2020a. Draft Lake Whatcom Management Program 2020-2024 Work Plan. Accessed 02/04/2020 at http://www.lakewhatcom.whatcomcounty.org/lwmp_2020-2024_work_plan.pdf.
• LWICT (Lake Whatcom Interjurisdictional Coordinating Team). 2020b. Draft 2020-2024 Lake Whatcom Management Program Work Plan. Public Comments and Questions Received February 5 – March 2, 2020 with Staff Responses. No. 38. Accessed 04/04/2020 at http://www.lakewhatcom.whatcomcounty.org/news/latest-news/lakewhatcom2020-2024workplanandresponsestocommentsnowavailable.
• Matthews, R.A., Strecker, A.L. Hilles, M., Pickens, J., Mitchell, R.J., and G.B. Matthews. Lake Whatcom Monitoring Project 2018/2019 Report (2020). Lake Whatcom Annual Reports. 28. Accessible at: https://cedar.wwu.edu/lakewhat_annualreps/28.
_________________________________
April Markiewicz is a toxicologist and the associate director at the Institute of Environmental Toxicology at Huxley College of the Environment at Western Washington University, as well as president of the People for Lake Whatcom Coalition.