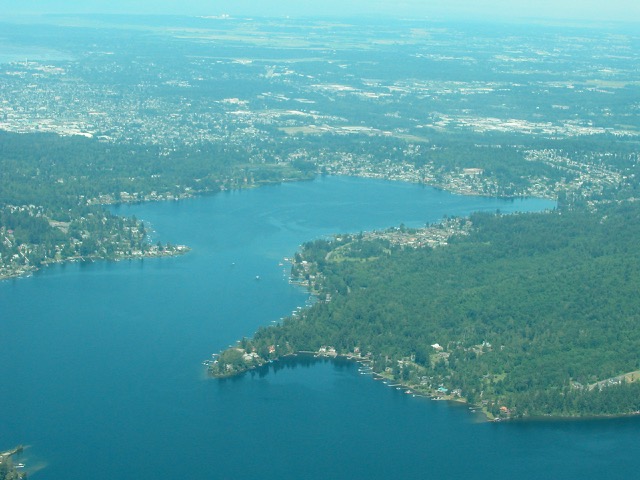
Lake Whatcom North Basin photo: April Markiewicz
Editor’s Note: The Lake Whatcom Monitoring Project was initiated in the 1980s to measure and track long-term lake data for temperature, pH, dissolved oxygen, conductivity, turbidity, and nutrients, including nitrogen and phosphorus. The work is performed by WWU’s Institute for Watershed Studies and funded by the city of Bellingham. This is the 18th article April Markiewicz has written about the Lake Whatcom Monitoring Project for Whatcom Watch.
by April Markiewicz
The latest report detailing the long-term water quality monitoring data for Lake Whatcom, our community’s primary drinking water source, indicates that not much has changed from past years. Though the rate of water quality degradation has slowed since its peak in the mid-2000s, it is still continuing today, almost 20 years later.
Granted, although public interest and concern about the quality of our drinking water source has waxed and waned over the last two decades, we have to acknowledge that our current efforts may not elicit observable, positive changes for another 20, 30, or even 50 years. We are trying to redress the actions and activities that were condoned by our community over the past 150 years. Unfortunately, many of those action and activities are still condoned today that allow people to develop properties, live, and recreate in the watershed, as well as log in the Lake Whatcom watershed.
Historical and current impacts to the lake and its surrounding watershed are not going to be mitigated in just a few decades. The lake is a large, dynamic aquatic ecosystem with a plethora of fish, macroinvertebrates, and microorganisms that support local waterfowl, wildlife, and predatory birds (eagles, hawks, owls). We have degraded that habitat for those organisms, not by design, but by not knowing how aquatic ecosystems are structured and function.
It comes down to our inflated opinion of ourselves in our surrounding environment. As Tyrone Hayes succinctly put it in 2020, “We assume that we’re masters of our environment, rather than being a part of it.” As a consequence, we just see the watershed as scenic and recreational habitat for our use, and, in some cases, abuse.
No Regard for Impacts
We build our houses and allow active logging in the watershed, as well as fish, boat, swim, and waterski on the lake without regard to our impacts on the habitat and the water quality of this community’s invaluable drinking water resource. The end result has been rapid water quality degradation and “aging” of the lake, especially over the last 20 years to become more biologically productive (and contaminated).
The losers in this situation are not only the biota that depend on the lake for their survival, growth, and successful reproduction, but also on our community. We take for granted that this invaluable resource on which we rely for our very survival as a community will be there for future generations.
Even with our current management actions to halt the decline in the lake’s water quality, there are no guarantees we will succeed given climate change and current practices that continue to allow residential development and logging in the watershed. No other communities in the world (except maybe in Russia or third world countries that have no regard for the health of their citizens) treats its precious drinking water source with such disdain, disrespect, and downright self-serving arrogance.
Our advancements in technology may help us in rectifying past environmental misuses and abuses, but it will not restore ecosystems that support all the species we value, including our own. The idea we can sacrifice the environment for personal gains is woefully outdated, shortsighted, and dangerous for our continued existence. The sooner we realize we are a part of the environment and the global ecosystem (and not some superior overlord of it), the sooner we will transition to being the stewards of our planet. Isn’t that what we are as the planet’s (supposedly) most intelligent and “sentinel” species?

Map: Lake Whatcom watershed and subbasins
(Strecker et al., 2021).
Drinking Water Source
Lake Whatcom, our community’s drinking water source, supports all of the city of Bellingham, as well as half of Whatcom County. The lake is comprised of three subbasins that are partially separated from each other by underwater sills. Basin 1 is the northernmost subbasin (see Map) and is about 100-feet deep. Basin 2 is between basins 1 and 3 and is about 80-feet deep. Basin 3 is the southernmost subbasin and is about 330-feet deep. Basins 1 and 2 each hold about 2 percent of the lake’s water, whereas basin 3 holds 96 percent.
The watershed encompasses almost 56 square miles in area, with 11 major tributaries (Anderson, Austin, Blue Canyon, Brannian, Carpenter, Euclid, Millwheel, Olsen, Silver Beach, Smith, and Whatcom creeks) discharging into the lake from the surrounding hillsides. The lake is about 10 miles in length, a mile across in width, 334-feet deep in its largest basin, and contains approximately 250 billion gallons of water. As such, it is going to take time for such a large system to respond to corrective management actions focused on its restoration.
Our community started those actions in earnest by the mid-2000s after Lake Whatcom monitoring data showed a dramatic acceleration in the decline of water quality. Since then, our community has spent millions of dollars installing stormwater treatment facilities around the lake, educating residents in the Lake Whatcom watershed to be stewards of our drinking water source, providing financial incentives to homeowners in the watershed to reduce impervious surfaces and improve stormwater infiltration on their property, purchasing undeveloped properties in the watershed to permanently remove them from being developed, getting 7,800 acres of state-managed forest board lands in the watershed reconveyed back to Whatcom County control, and managing forest practices within the watershed to reduce erosion and particle loading to the lake.
Some of the most recent actions by the Lake Whatcom Interjurisdictional Coordinating Team (LWICT, 2022) consisting of the city of Bellingham (the water purveyor), Whatcom County, and the Lake Whatcom Water and Sewer District are as follows:
Land preservation (removal of undeveloped lands from development): 11,291 acres protected to date. The 2021 cost equaled $1,586,276.
A total of 200 pounds of phosphorus reduced per year through 2021. A total of 209 properties have completed residential stormwater runoff reduction projects since 2011. Cost in 2021 was $2,078,945.
A total of 1,050 lake water quality samples were collected in 2021 with an additional 150 samples from the tributaries as part of the Lake Whatcom Monitoring Project. The 2021 costs were $596,875.
In 2021, there were 293,537 visits to Lake Whatcom watershed. Whatcom County Parks maintained 18 miles of trails and 27 pet waste stations in the watershed in 2021, at a cost of $365,625.
The Aquatic Invasive Species Program for Lake Whatcom and Lake Samish resulted in 14,415 boats being inspected at the public launch sites, of which 1,146 had standing water that needed to be drained, 136 boats had aquatic plants that had to be removed, and 10 boats had to be decontaminated for invasive mussels. The 2021 expenditures were $565,185. (Private boat launches are not monitored.)
Septic system inspections resulted in a 28 percent increase in compliance; however, there were four sewer overflows in the watershed in 2021. Costs including capital projects were $2,685,195.
Education and engagement of watershed residents resulted in 63 more Homeowner Incentive Projects, 300 new homeowners subscribed to the Lake Whatcom Newsletter, with a total of 5,000 subscribed as of 2021, at a cost of $155,771.
And last, but not least, in direct conflict with its stewardship role, the Lake Whatcom Management Team approved 18,472 feet of forest road construction in the watershed, 289 acres of timber harvest, and 43 acres to be treated with herbicides in the watershed, for a total cost in 2021 of $375,000.
Total costs for just 2021 were (give or take): $8,034,247 — paid by you and me.
Almost all of these actions are focused on one goal: reducing nutrients, specifically phosphorus, from entering the lake. A high price to pay for actions that should have been taken decades ago. It took public engagement in the early 2000s to alert our elected officials that this community resource is vitally important and merited the highest level of protection. It also took regulatory involvement at the state and federal levels to mandate changes in management policies and strategies to elicit changes.
That said, change takes time, and, by the time these local and county level actions were fully implemented, Lake Whatcom had already transitioned to a more biologically productive (i.e., eutrophic) lake (Matthews et al., 2007). The consequences to our community have resulted in higher taxes to fund these projects; higher utility rates to address increased water treatment processes to remove particles, chemicals and other contaminants from the lake water before it is distributed to our water taps; and higher health risks to those in our community who are immunocompromised.
So Much Data and Yet …
There are so much data being provided in the Lake Whatcom Annual Monitoring Reports, yet no data on what might be in our community’s tap water. For example, data on gasoline in our tap water from all the boats, jet skis, and planes on the lake, as well as contaminants from fertilizers and pesticides used in the watershed are nonexistent or conducted by third parties that don’t report to the public. We also have no idea about metals and organic pollutants in stormwater runoff, personal care products, pharmaceuticals, and other airborne contaminants entering Lake Whatcom that may be unaffected by water treatment processes and coming out in our tap water.
Current Water Quality Data
Key points from the 2020/2021 Lake Whatcom Monitoring Report (Strecker et al. 2022) are as follows:
Indications of continued eutrophication (increased biological productivity) in Lake Whatcom persists.
DO (dissolved oxygen) concentrations are depleted rapidly once the lake’s subbasins thermally stratify in the late spring and early summer. By July, DO levels at 14 meters deep in basin 1 are below 4 mg/L required for fish survival. By August, concentrations are below 2 mg DO/L and by September at 0 mg DO/L. These trends have been apparent since 2003 (see Figure 1).
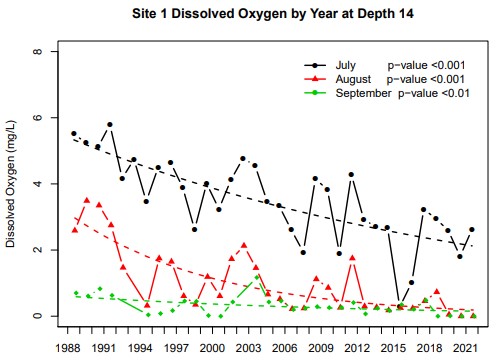
Figure 1. Trends in dissolved oxygen over time in basin 1 at 14 meters (~46 feet) sampled in July, August, and September from 1988 through 2020 (Strecker et al., 2022).
Chlorophyll (Chl) concentrations, a direct measure of algal biomass and indicator of a lake’s biological productivity, appear to have leveled off since 2010 (see Figure 2).
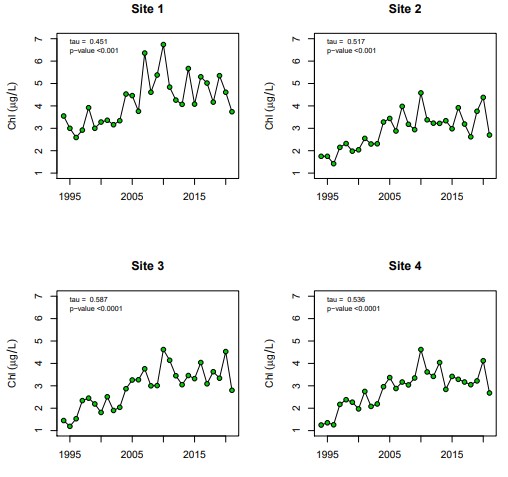
Figure 2. Median summer near-surface chlorophyll concentrations (June – October) at each sampling site from 1994 – 2021 (Strecker et al., 2022).
Green algae (Chlorophyta) numbers, in general, are continuing to increase throughout the lake compared to previous year’s data (see Figure 3).

Figure 3. Log10 plots of median summer near surface green algae (Chlorophyta) counts from June through October all sites and depths (1994 – 2021) (Strecker et al., 2022).
Blue-green bacteria (Cyanobacteria) are also continuing to increase throughout the lake, especially in basins 2 and 3 (see Figure 4).
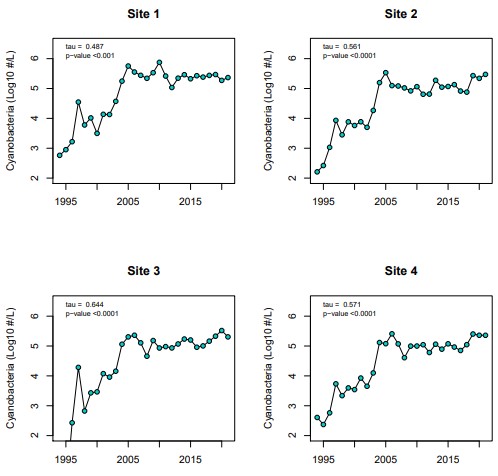
Figure 4. Log10 plots of median summer near surface Cyanobacteria counts for each site (June – October) from 1994 – 2021 (Strecker et al., 2022).
Total phosphorus (TP) in the surface waters is still measurable in basin 1, indicating potential ongoing inputs into the basin; however, in basins 2 and 3, it is below analytical detection limits, indicating potentially less inputs into the basins, as well as is rapid biological uptake and utilization (see Figure 5).

Figure 5. Median summer near-surface total phosphorus concentrations at each sampling site from 1994 – 2021 (Strecker et al., 2022).
Dissolved inorganic nitrogen (DIN) concentrations in the surface waters continue to rapidly decline, and, by June, are below analytical detection limits (see Figure 6). Additional analyses of the DIN data, comparing spring versus summer DIN concentrations found that summer utilization rates are continuing to accelerate and outpace spring rates.
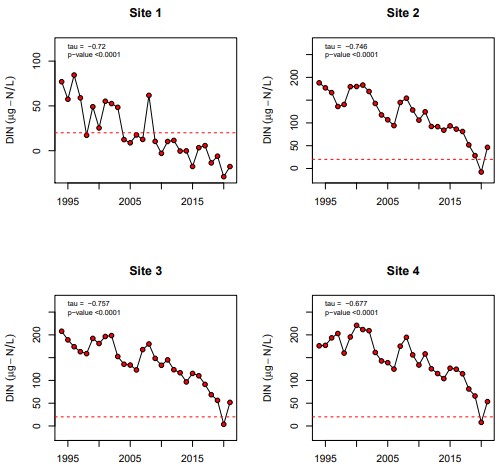
Figure 6. Minimum summer near-surface dissolved inorganic nitrogen (DIN) concentrations at each sampling site from (June – October) 1994 – 2021 (Strecker et al., 2022).
What Do the Data Mean?
Most of the 2020/2021 water quality data were within historical norms except for surface water temperatures and pH data in July 2021. According to Strecker et al. (2022), the record-breaking temperatures in our region during that timeframe caused water temperatures in the lake to be the highest ever recorded since data collection began in 1988. Concurrently, the warmer temperatures also stimulated algal growth and photosynthesis resulting in the highest pH values (9.5) ever recorded in the lake.
Overall, the data indicated that biological productivity in Lake Whatcom is still occurring and gradually increasing over time, resulting in impaired water quality conditions especially during the summer months. Current management efforts may be helping to keep productivity levels in the lake from being much higher. For example, Strecker et al. (2022) note that chlorophyll and green algal counts seem to have stabilized since 2004; however, Cyanobacteria appear to be increasing each year throughout the lake. When factored in with the declining DIN, Strecker et al. (2022) caution that lake conditions are becoming increasingly favorable for the growth of nitrogen-fixing Cyanobacteria, many of which are able to produce toxins harmful to wildlife and humans.
If toxin-generating Cyanobacteria are eventually identified in Lake Whatcom, there are no publicly available plans on how the Lake Whatcom Interjurisdictional Coordinating Team plans to address the problem. Do we have to resort to boiling our tap water, using end-of-the-tap filtration devices, resort to drinking bottled water, or …
Other Threats to Lake Whatcom
Other threats to Lake Whatcom over which we currently have limited control include the following:
1. Aquatic Invasive Species (AIS): The city of Bellingham and Whatcom County conduct boat inspections at three public boat launches in the Lake Whatcom watershed to prevent the introduction of AIS into the lake. Unfortunately, these inspections are usually only conducted from April through September, enabling potentially contaminated boats to still be launched into the lake during the other six months of the year. If zebra or quagga mussels become established in Lake Whatcom, they would damage public and private infrastructure, cause long-term taste and odor issues in our drinking water, and outcompete native aquatic species for resources. Replacing infrastructure, as well as applying chemical treatments to the lake will cost us taxpayers hundreds of millions of dollars.
2. Climate Change: It can cause direct, as well as indirect catastrophic effects on Lake Whatcom water quality. The water quality monitoring data over the years have clearly illustrated the effects of warmer summer temperatures on water quality parameters. Higher temperatures accelerate biological productivity and exacerbate anoxic conditions in the bottom waters of the lake’s subbasins, resulting in habitat loss and the release of phosphorus, mercury, and other metal contaminants, as well as hydrogen sulfide from the sediments. These conditions can cause fish kills, odor and taste problems, and further degrade water quality.
We can also expect rainfall patterns to change and snowpack levels to decrease significantly in the next few decades. Water quality and quantity will become an even higher priority given that the population in Whatcom County is expected to grow significantly in the next several years, putting even more pressure on the lake to provide clean and safe drinking water for us all.
Warmer, dryer conditions have already raised concerns about the increased risk of wildfires in the Lake Whatcom watershed. Given last year’s record-breaking heatwave, the city of Bellingham and the county are already working to remove forest fuels (dead branches on trees, downed trees, logs) adjacent to residential areas. They are also thinning densely planted second-growth forested properties in the watershed.
3. People: the biggest threat to Lake Whatcom water quality is the thousands of people who live in the watershed. It is hypocritical to insist that preserving and protecting Lake Whatcom is our community’s priority when residential development is allowed to continue in the watershed. An estimated 1,400 units can still be built in the watershed, and, in Sudden Valley, an additional 5,000 units can be built. There are calls for changes to the Lake Whatcom Land Acquisition Program, including changes to its strategies and leadership, to be more proactive. Waiting for people to come forward who are willing to sell their undeveloped property in the watershed to the city of Bellingham will doom any chances of removing these units from being developed.
If we as a community really care about preserving and protecting our drinking water source for ourselves and future generations, then we need to make some hard choices. Put the funding and resources in place now to expedite getting protections in place to meet the TMDL goals. Let’s not base our community’s future welfare and existence on “good intentions” to meet TMDL goals by the federal deadline of 2066, but rather on what needs to be done now.
References
• LWICT (Lake Whatcom Interjurisdictional Coordinating Team). 2022. 2020 Lake Whatcom Management Program Progress Report. Accessed 03/28/2028 at lwmp_2021_progress_report_FINAL-min.pdf – Google Drive
• Matthews, R.A., M. Hilles, J. Vandersypen, R.J. Mitchell and G.B. Matthews. 2007. “Lake Whatcom Monitoring Project 2005/2006 Final Report.” Western Washington University, April 12, 1999. 496 pp. Available online at https://cedar.wwu.edu/lakewhat_annualreps/9/
• Strecker, A, M. Hilles, J. Pickens, R. Mitchell, R.A. Matthews, and G.B. Matthews. 2022. “Lake Whatcom Monitoring Project 2020/2021 Report.” Western Washington University. Lake Whatcom Annual Reports 30. 372pp. Available online at: https://cedar.wwu.edu/lakewhat_annualreps/30/
____________________________
April Markiewicz is a toxicologist and recently retired as the associate director at the Institute of Environmental Toxicology at the College of the Environment at Western Washington University. She is also the president of the People for Lake Whatcom Coalition.