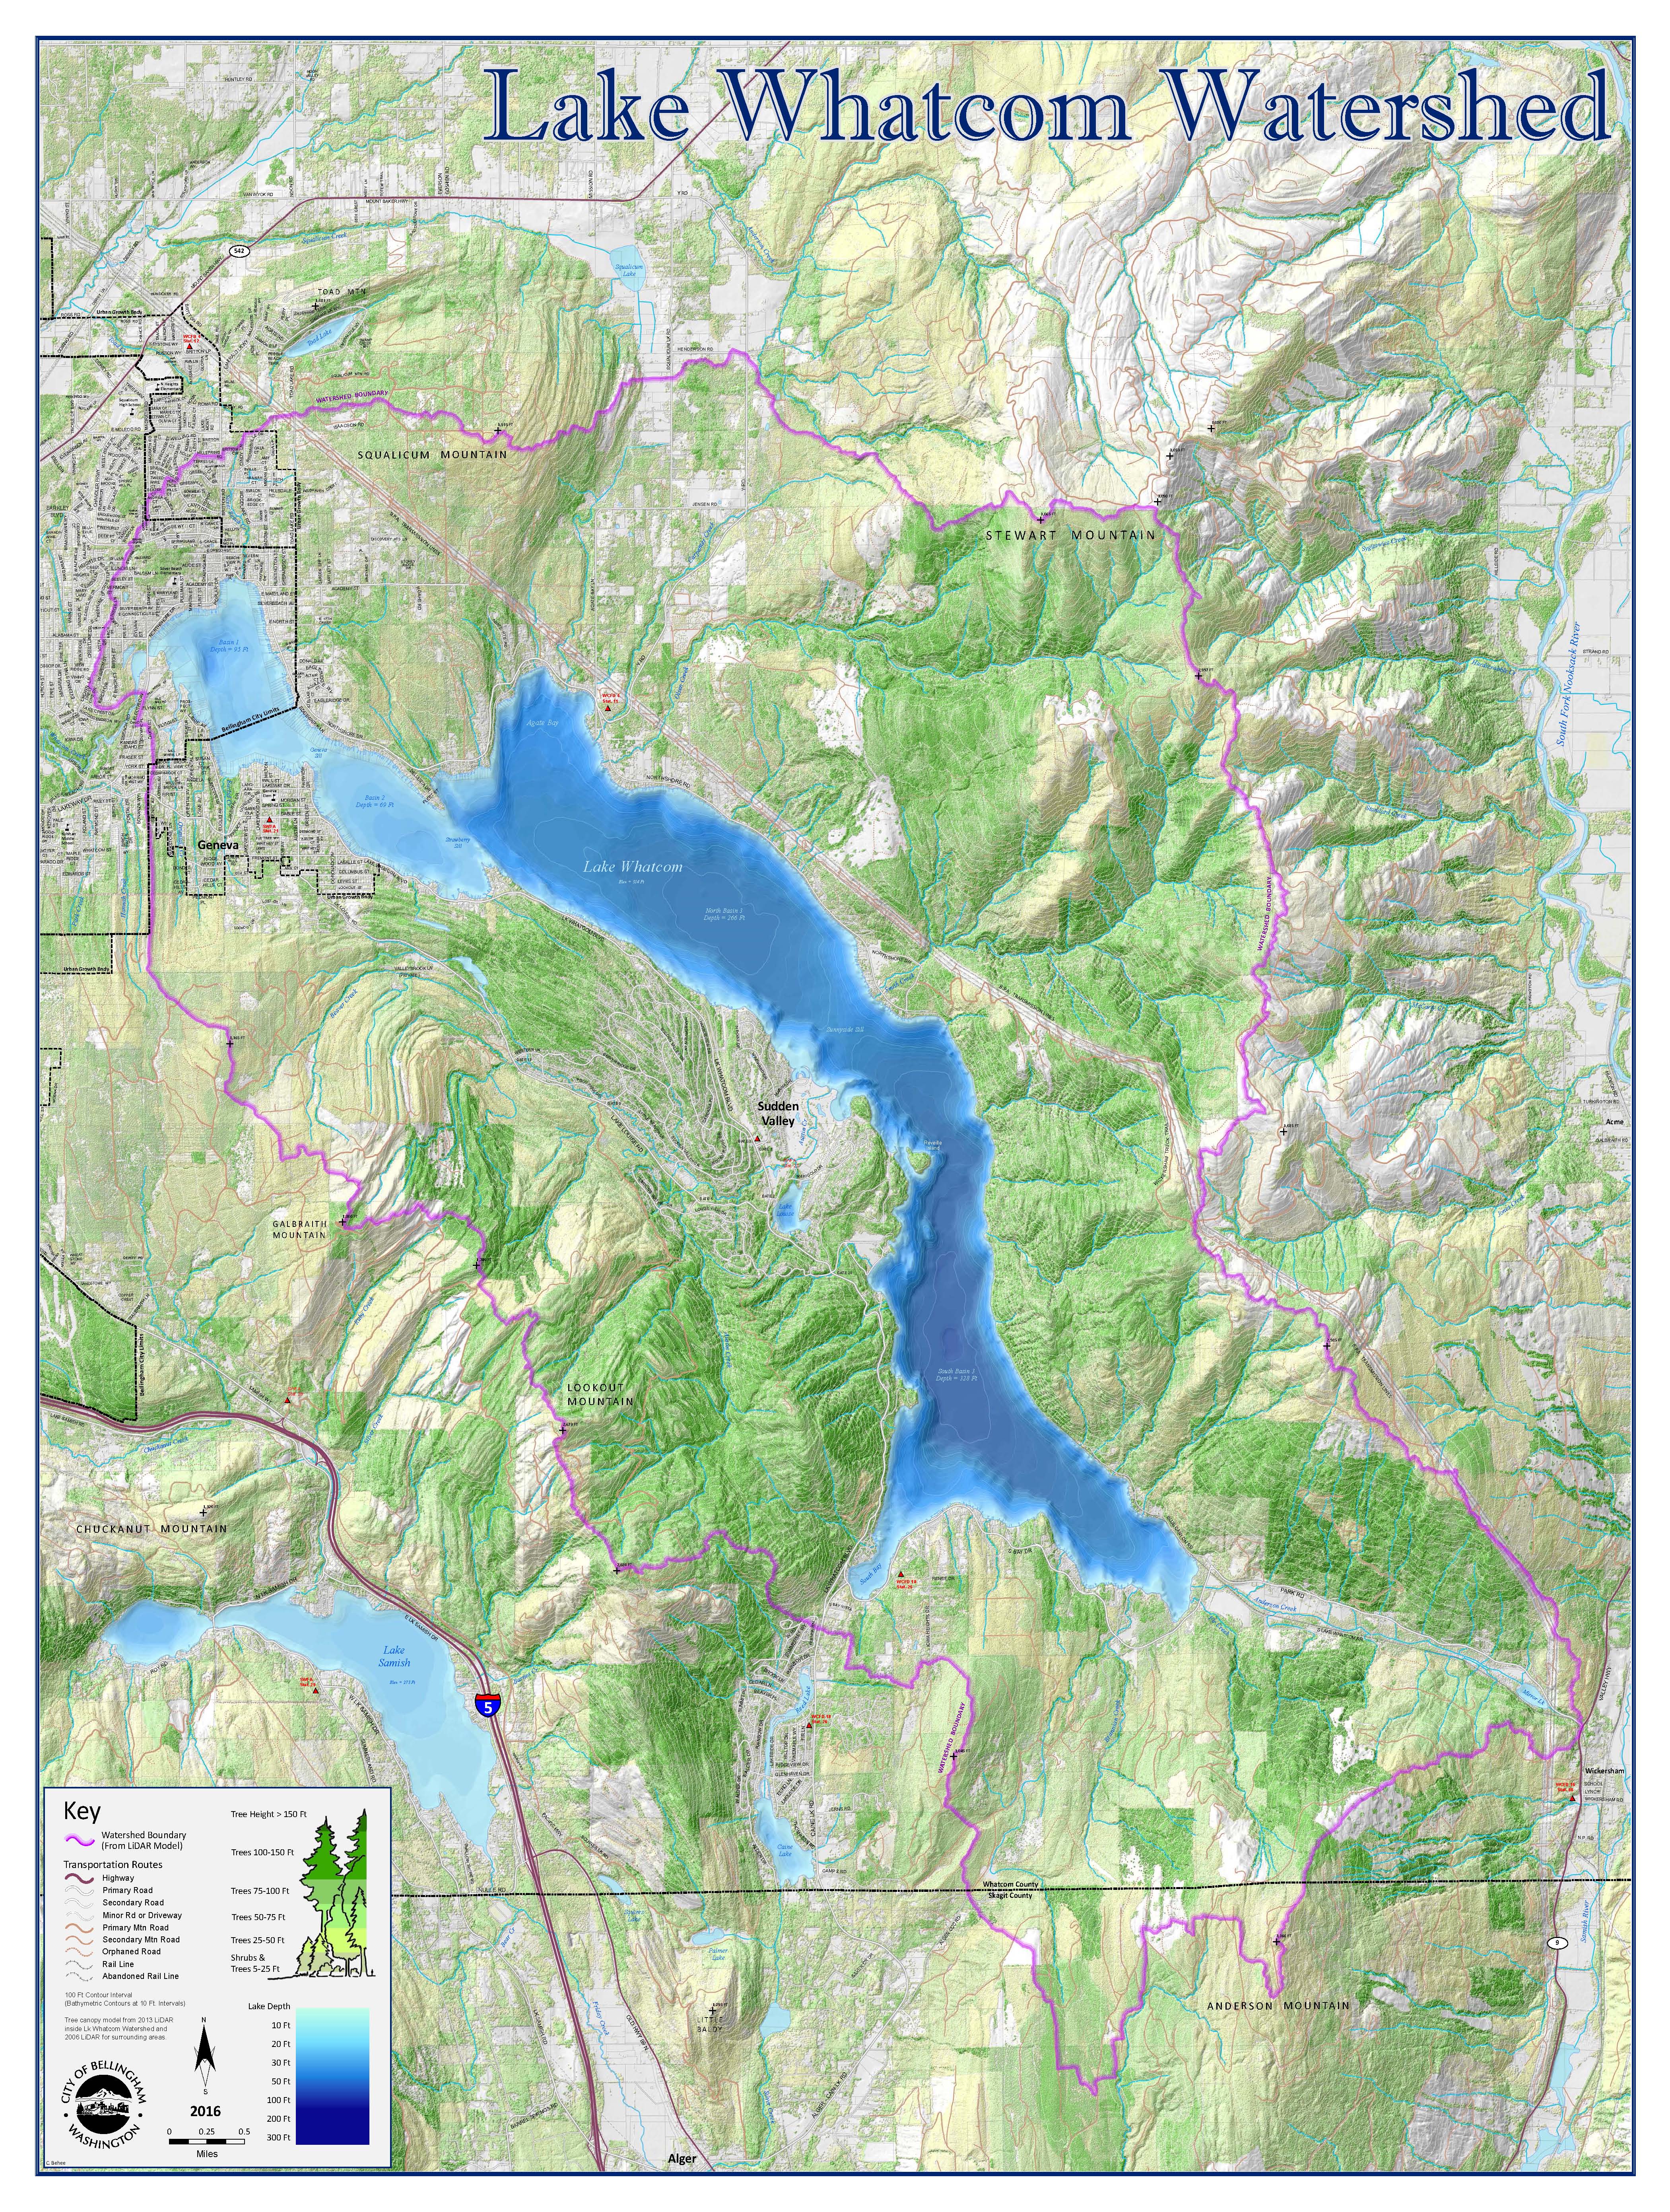
The lake is comprised of three subbasins. Sample Site 1 is located in Basin 1. Sample Site 2 is located in Basin 2. Sample Sites 3 and 4 are located in Basin 3. Courtesy: City of Bellingham
by April Markiewicz
The latest Lake Whatcom Monitoring Report by Matthews et al. (2016) is rife with terms like “atypical,” “unusual,” “not observed (before) in Lake Whatcom,” “the highest levels recorded at that site in 17 years,” and “unlike any results measured in the last 30 years.” The report describes Lake Whatcom water quality data collected last year compared to historical monitoring data collected over the last 60 plus years.
We need to take notice because Lake Whatcom is the primary drinking water source for about 100,000 residents in Bellingham and Whatcom County. Monitoring the lake and its water quality dates back six decades and provides an invaluable record of how our actions have accelerated its decline. Institute Director Dr. Robin Matthews, director of the institute, and her colleagues have been collecting samples, analyzing them and reporting on the status of the lake since the mid-1980s as part of a long-term monitoring project for the city of Bellingham.
The lake is comprised of three sub-basins (see map on left). The northernmost Silver Beach area basin, Basin 1 (sample Site 1) is approximately 100 feet deep. Residential development dominates this basin’s watershed area. The Geneva area basin, Basin 2 (sample Site 2) is 40-60 feet deep. The Sudden Valley residential subdivision is located in the western part of the watershed. Basin 3 (sample Site 3 – north part of basin and Site 4 – south part of basin) is 328 feet deep and contains 96 percent of the lake’s total volume. Residential development in this sub-watershed is sparse.
2015 Anomalies
Matthews et al (2016) stated that the abnormal results they measured in the lake last year were probably caused by two factors: 1) the warm weather from February through July 2015, which raised surface water temperatures throughout the lake to be higher than any measured in the past 30 years, and 2) the water in Basin 3 did not completely mix from top to bottom during the winter months for the first time ever recorded, probably due to weak winter storms and the shape of the basin. This caused oxygen deficits in the bottom waters from 2014 to remain and get worse throughout 2015.
These factors set up conditions within the three basins of the lake that served to accelerate and enhance biological and chemical processes, resulting in higher highs and lower lows for several key water quality parameters, including oxygen levels.
The mild winter, plus warmer spring and early summer weather ,c aused the lake to thermally stratify into separate layers sooner with warmer, less dense, oxygenated water in the upper layers above colder, denser water below. Biological processes in the isolated deeper water quickly consumed the dissolved oxygen, creating unoxygenated water in Basins 1 and 2 and oxygen deficits in Basin 3.
These oxygen depletions occurred not only earlier but happened faster and lasted longer over the warm summer and fall, which affected much larger volumes of water in each basin, if not the entire lake. They also promoted chemical reactions in the unoxygenated sediments and overlying waters that caused metal contaminants mercury and lead, as well as nutrients like phosphorus and noxious byproducts from bacterial metabolism, including ammonia and hydrogen sulfide, to be released from the sediments into the overlying water. The warmer water extended the length of time these reactions occurred and increased their concentrations in the overlying waters, as seen in the 2015 data.
The warm weather also accelerated the rate of evaporation causing levels to drop months ahead of schedule. In spring 2015, the lake level was at about 314.5 feet. By July, it was at 313.4 feet, a level usually not seen until September (Abell, 2015). According to Bellingham’s Public Works department, low water levels affect flows to Whatcom Creek and impact fish habitat. Lake residents have trouble getting water through their intake pipes if the level drops below 310 feet. If levels drop below 309 feet, Whatcom Creek will have little water flow, and at 308 feet, water flow in the city’s intake pipe for supplying water to the 100,000 residents will be affected (Abell, 2015).
Accelerated evaporative water loss from the lake is occurring again this year due to the early onset of warmer weather. Coupled with diminished snow packs that cannot replenish water to the lake throughout the summer months, the city anticipates that water levels will drop again this summer. The question remains, however, just how low it will drop.
What the Data Show
The following are some of the more important water quality indicators reported in the 2014/2015 Lake Whatcom Monitoring Program Annual Report:
I. Surface water temperatures were warmer than historic values throughout the lake with July and November temperatures significantly higher than the highest ever measured in the 1988 through 2014 record.
II. Dissolved oxygen profiles were unlike any patterns measured in the past 30 years (see Figure 1).
Dissolved Oxygen vs. Temperature
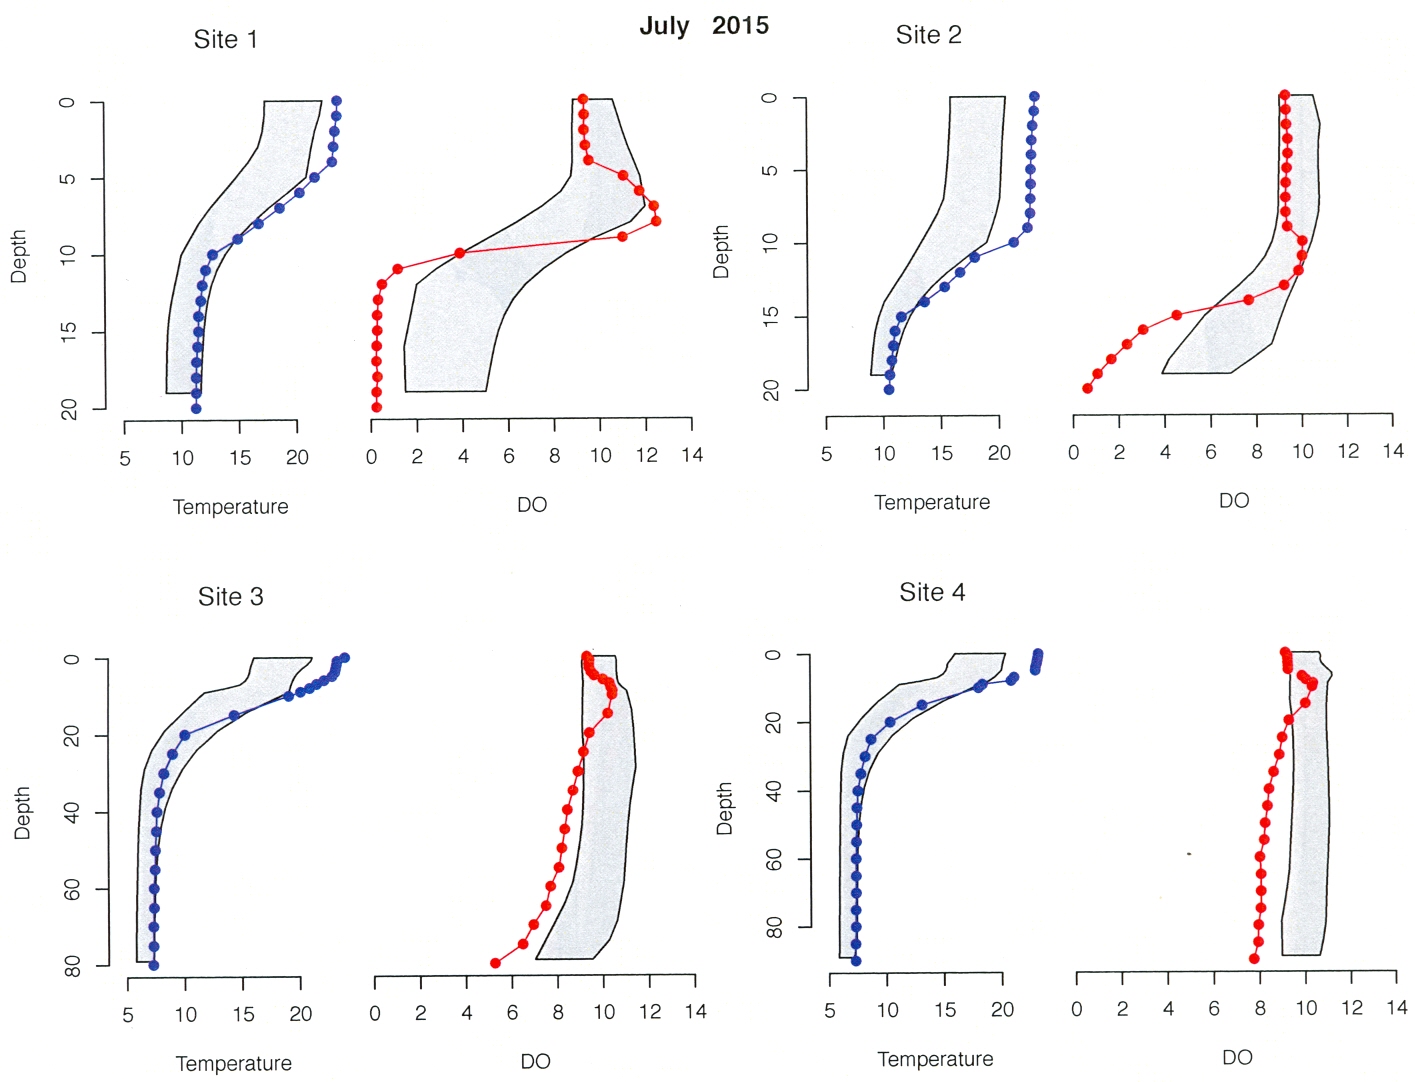
Figure 1. July 2015 temperature (on left) and dissolved oxygen (on right)
profiles with depth compared to 1988 through 2014 minimum/maximum
ranges (shaded areas). Dissolved oxygen profiles were unlike any patterns
measured in the past 30 years.
A. The atypical oxygen profile in Basin 3 was due to incomplete mixing during the winter months resulting in carryover of lower oxygen levels that decreased further over the warm 2015 summer months.
B. Oxygen levels in Basin 1 dropped to < 1 mg/L much faster than expected, i.e., two months ahead of time from 12 meters (~39.4 feet) down to the bottom (see Figure 2).
Dissolved Oxygen 1988 through 2015

Figure 2. Trends in dissolved oxygen over time in Basin 1 at 12 meters (~39
feet) sampled in July and August from 1988 through 2015 (Matthews et
al., 2016).
All of Basin 1 bottom waters were without oxygen by early July.
As a result, hydrogen sulfide levels caused by bacterial metabolism under anoxic conditions were the highest ever recorded in the last 17 years.
1. Total phosphorus (TP) levels increased in all basins (see Figure 3).
Phosphorus 1994 through 2015
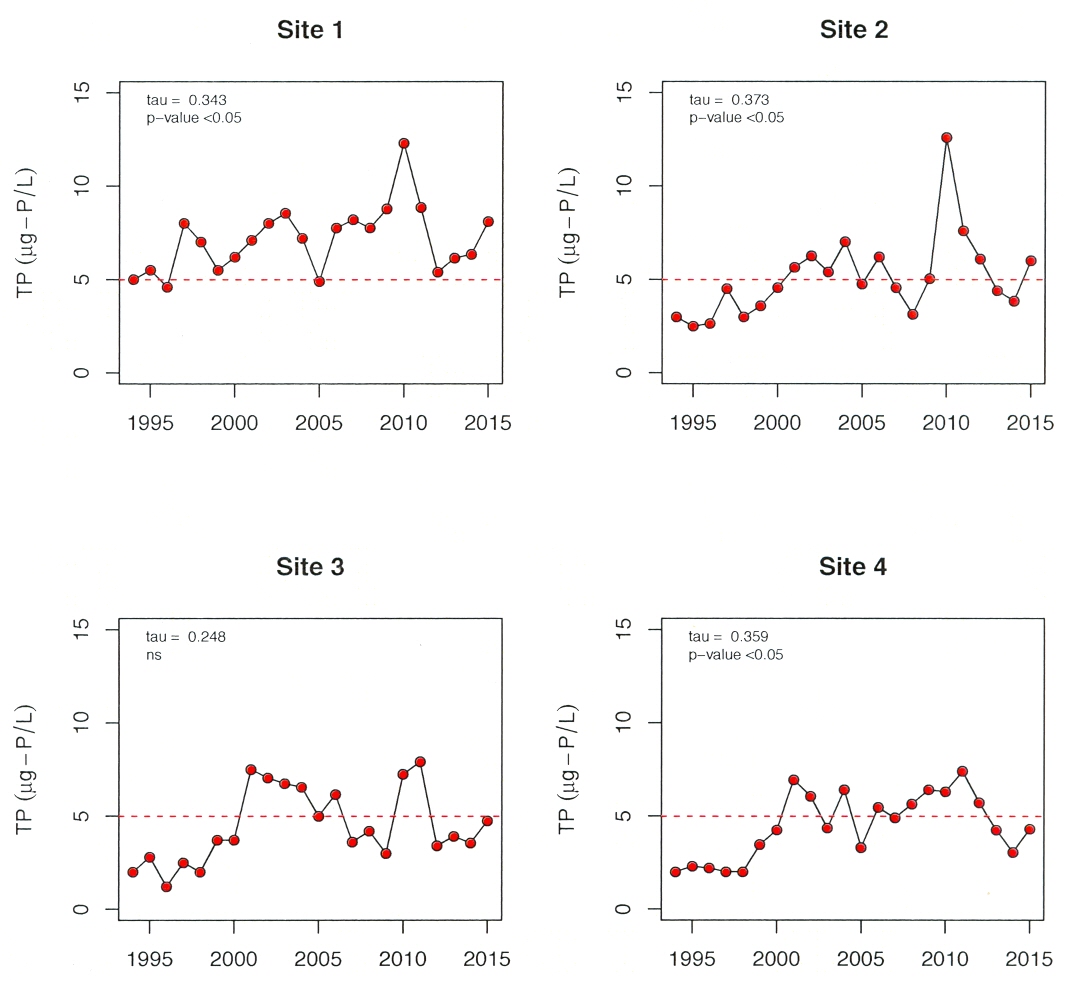
Figure 3. Median summer near-surface total phosphorus concentrations over
time at each sampling site from 1994 – 2015 (Matthews et al., 2016).
2. Chlorophyll (Chl) concentrations increased in Basin 3, but overall seem to have stabilized in basins 1 and 2. Only the south part of Basin 3 had chlorophyll levels declined (see Figure 4).
Chlorophyll 1994 through 2015
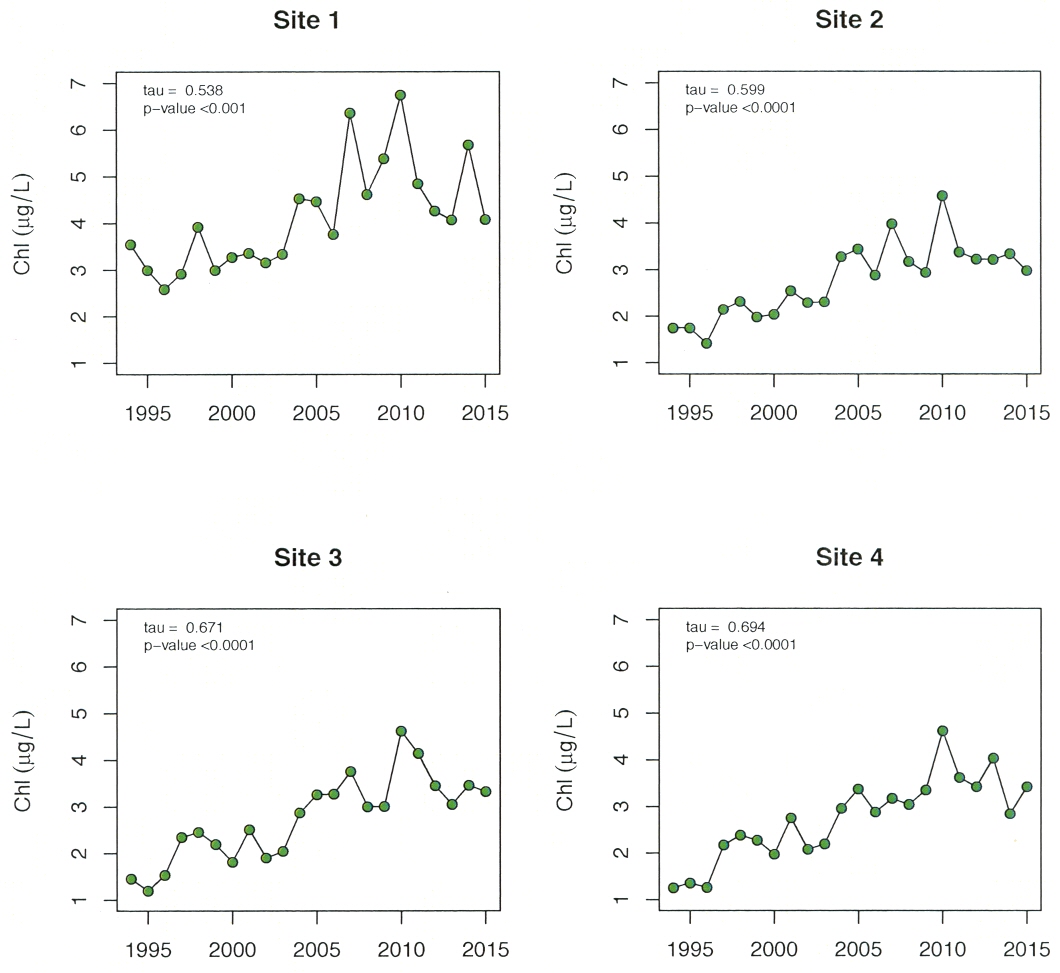
Figure 4. Median summer near-surface chlorophyll concentrations over time
at each sampling site from 1994 – 2015 (Matthews et al., 2016).
3. Bluegreen bacteria (Cyanobacteria) populations remain high in all three basins and seem to have stabilized in numbers, however they continue to be the dominant species over green algae (see Figure 5).
Blue-Green Bacteria
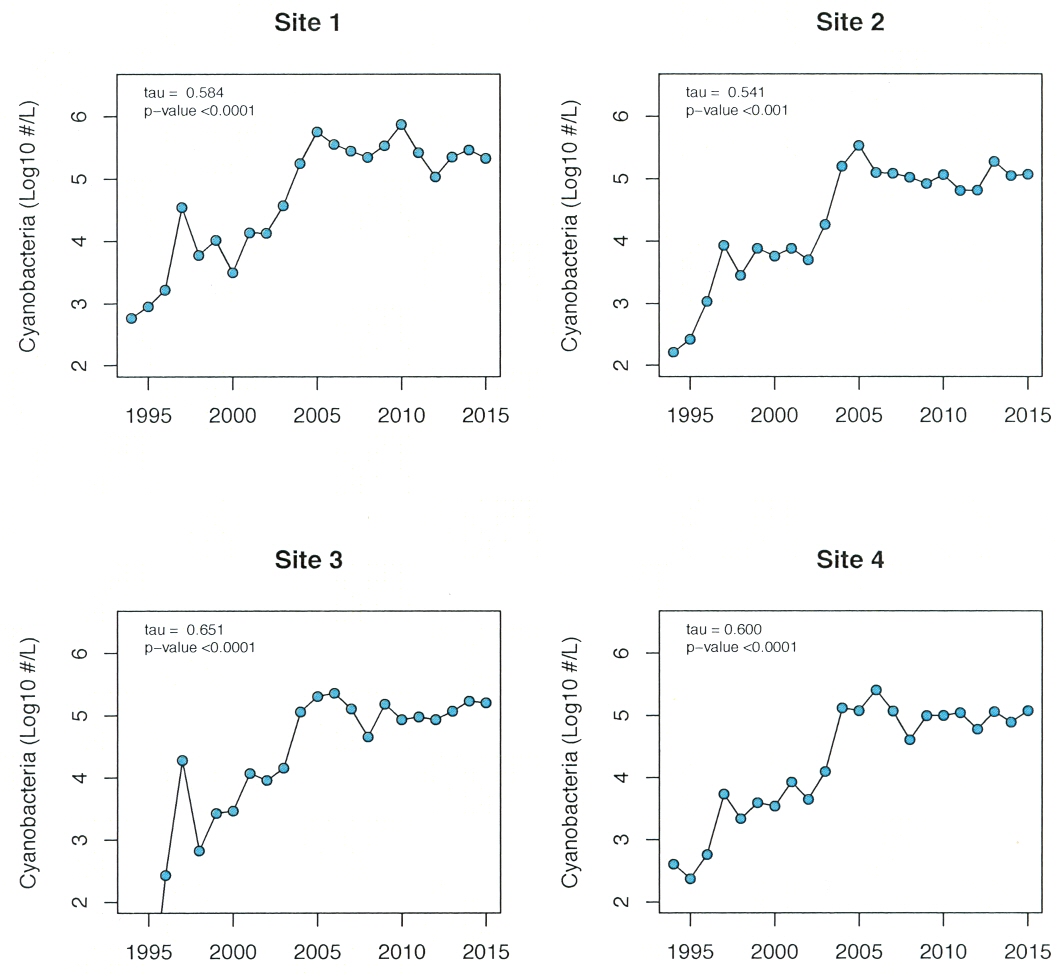
Figure 5. Log 10 plots of median summer near-surface Cyanobacteria counts
(1994 – 2015) (Matthews et al., 2016).
4. Trihalomethanes (THMs), which are known carcinogens created during the disinfection process of water treatment increased in tap water from January through June, with a sharp increase to 0.06 mg/L from July through September (see Figure 6), but still below the maximum allowable contaminant level of 0.08 mg/L. (Note: The number of sites used to calculate the quarterly averages increased from four to eight in 2012 (vertical dotted line).
Total Trihalomethane January through December 1992 through 2015
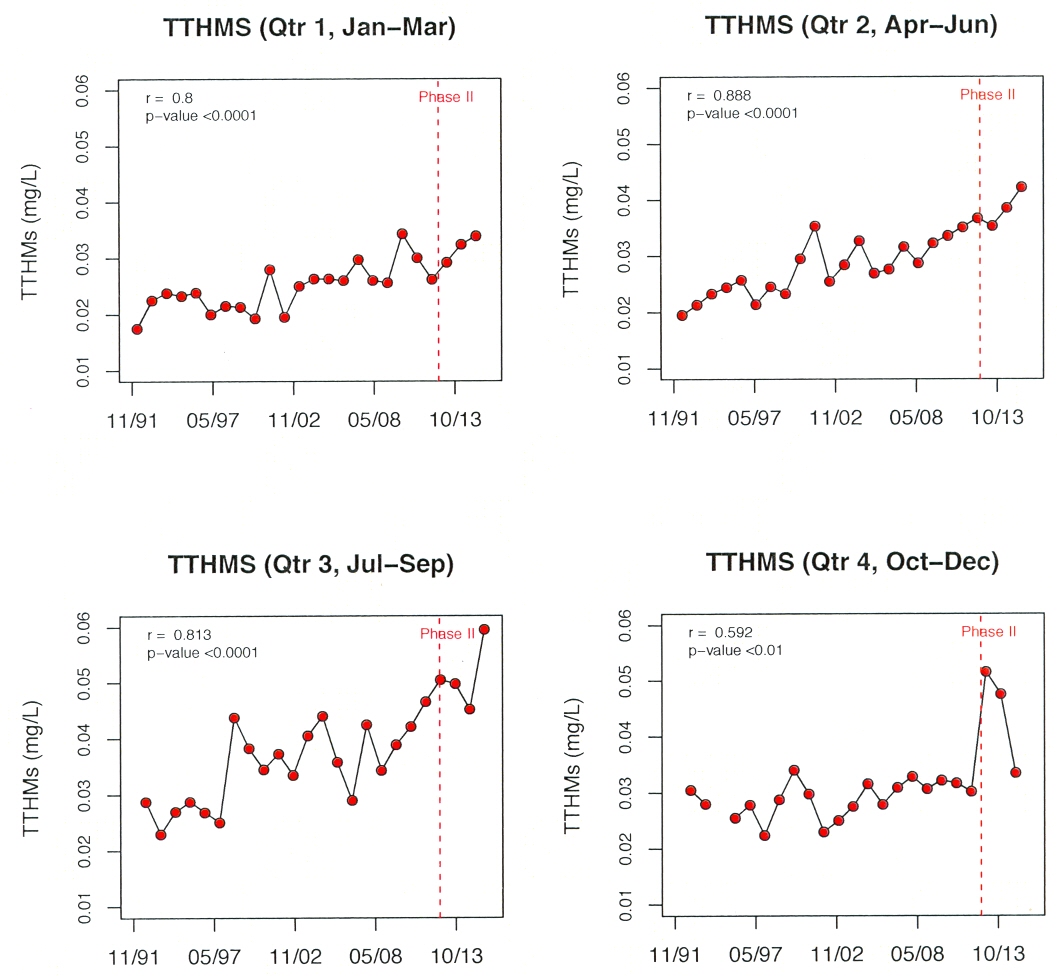
Figure 6. Quarterly total trihalomethane (TTHM) concentrations in the
city of Bellingham’s water distribution system from 1991 – 2015 (Matthews
et al., 2016).
Water Quality and Quantity
The ramifications of trying to maintain water quality and quantity if this weather pattern becomes the new norm for our region are obvious. We will need to redouble our efforts to clean up and restore the lake’s water quality to comply with standards set forth in the Clean Water Act, as mandated by state and federal law. In doing so, we will ensure high quality drinking water for ourselves and future generations, and in sufficient quantities that balance residential, recreational, and industrial demands.
Responsible Party
Though the water looks fine to the casual observer, Lake Whatcom has been listed by the Washington Department of Ecology as an impaired waterbody under section 303(d) of the Clean Water Act since 1998. The lake water fails to meet several water quality standards that define acceptable concentration levels known to be safe for humans and aquatic organisms, i.e., do not cause health issues. It didn’t get that way on its own. Residential development, as well as recreational activities on and in the water are the main culprits for causing water quality degradation and chemical contamination of the water. So in federal and state legalese, we are the Responsible Party.
As the Responsible Party, we are required by state and federal law to stop our actions that are contributing to the decline in water quality and take whatever actions are necessary to be in compliance with state and federally mandated water quality standards. That requires everyone’s commitment to make sure those actions are taken, as well as a commitment to invest the money and time.
Specific actions include preventing future residential development around the lake that allows pet waste, fertilizers, metals, oil, gasoline, untreated storm water runoff, etc. to get into the lake. It also includes the full participation of all the residents currently living in the watershed in making their properties function like a forested watershed, i.e., infiltrate all storm water runoff and keep it from going into the lake. The residents in the watershed are our community’s first defense in protecting the lake and being its stewards.
Some people have pointed fingers at all the boats, jet skis, and float planes on the lake as sources of contaminants. We have to remember that Lake Whatcom has been designated as “Navigable Waters” by the Washington state Department of Natural Resources even though it is also our community’s drinking water source. Drinking water sources are usually protected from all development and personal use, but historical uses and its designation by WDNR has set up this conflict. Indeed, gasoline was measured not only in untreated lake water, but also in tap water when such measurements were being made by the city from 2000-2005. Since then, 2-stroke engines, a main source of uncombusted gasoline into the water, have been banned from use on the lake.
The Price Tag
The Environmental Protection Agency just approved the city of Bellingham, Whatcom County and the Whatcom County Water and Sewer District’s 50-year plan to reduce the amount of phosphorus entering the lake (Relyea, 2016). Over the next five years it is estimated to cost us $50 million. Though this price tag seems staggering, we should consider this as a $10 million dollar per year investment that in 50 years will ensure our community has high quality and enough quantity of water to serve our future needs for hundreds of years.
Comments posted online when the news was announced ranged from supportive to angry and resentful. Several people lamented that their property taxes will be increased, whereas others recommended we just walk away from our responsibilities and use another source as our drinking water. This option is illegal and would open up our community to daily fines for noncompliance with state and federal regulations.
Another recommended the old (and discredited) “flush it” solution, i.e., open up the floodgates to Whatcom Creek and flush all that water out into Bellingham Bay. So, how does this method reduce phosphorus loading to the lake from the surrounding watershed? Does it restore other water quality parameters to federal and state standards? Isn’t that a wasteful use of our drinking water source and therefore against state law? And by the way, what would all that freshwater do to the marine organisms and habitat in the bay?
Fortunately, there are many other more informed people who tried to exlain why we 1) have to pay, 2) cannot “walk away,” 3) flush away, or 4) “take” another body of water to which we do not have the water right.
The Lake Whatcom Investment
Our community has already spent tens of millions of dollars to capture and treat storm water runoff before it enters the lake. The city has purchased undeveloped lots in the watershed to keep them from being developed and devoted staff time and resources to work with residents in the watershed to convert lawns to natural vegetation that filters rainwater and runoff. Moreover, this year the city of Bellingham will be constructing a $17.8 million lake water pretreatment facility to address algal blooms that have clogged the lake water filtration system each year since 2009 (Wohlfeil, 2015). It is an expensive, but necessary fix to ensure adequate water supplies in the future.
Our community is investing in its future existence by taking these actions and thereby ensuring it has clean, safe drinking water for everyone. It has cost us money and will cost even more money in the future, but by having a plan approved by the EPA and taking a phased approach, over the next 50 years we will achieve our goals, together.
References
- Wohlfeil, S. 2015. Lake Whatcom level dropping months ahead of schedule. The Bellingham Herald, Bellingham, WA, July 1, 2015. Accessible at http://www.bellinghamherald.com/news/local/article26015953.html.
- Matthews, R.A., M. Hilles, J. Vandersypen, R.J. Mitchell, and G.B. Matthews. 2016. “Lake Whatcom Monitoring Project 2014/2015 Report.” Prepared for the city of Bellingham, Bellingham, WA. February 23, 2016. 267 pages.
- Matthews, R.A., M. Hilles, J. Vandersypen, R.J. Mitchell, and G.B. Matthews. 2015. “Lake Whatcom Monitoring Project 2013/2014 Report.” Prepared for the city of Bellingham, Bellingham, WA. February 26, 2015. 339 pages.
- Relyea, K. 2016. EPA OKs plan for lake cleanup. The Bellingham Herald, Bellingham, WA, Volume 128, No. 103, page A1, Tuesday April 12, 2016. Accessible at http://www.bellinghamherald.com/news/local/article71265647.html.
____________________________________
April Markiewicz is a toxicologist and the associate director at the Institute of
Environmental Toxicology at Huxley College of the Environment at Western Washington
University, as well as president of the People for Lake Whatcom Coalition.