by April Markiewicz

Lake Whatcom watershed and sub-basins (Matthews et al., 2017)
Clean water. Each of us gets up every morning, turns on the water faucet and expects to have clean, fresh water at our disposal. We make coffee with it, prepare food, brush our teeth, take a shower, wash dishes, flush toilets and go about our daily business. We never question whether we will have access to clean water, regardless of where we go and what we do in our daily activities because, like so many other communities, we take our water for granted.
Many people in our community don’t even know where their water comes from except from the end of a faucet. If asked, they may guess that it comes from an underground aquifer or is piped in from some distant source. Few, however, would guess that it comes from Lake Whatcom just a few miles east of downtown Bellingham. One look at the lake and its watershed would convey to the casual observer that it is more of a recreational destination and resort area rather than a drinking water source for all of Bellingham and half of Whatcom County.
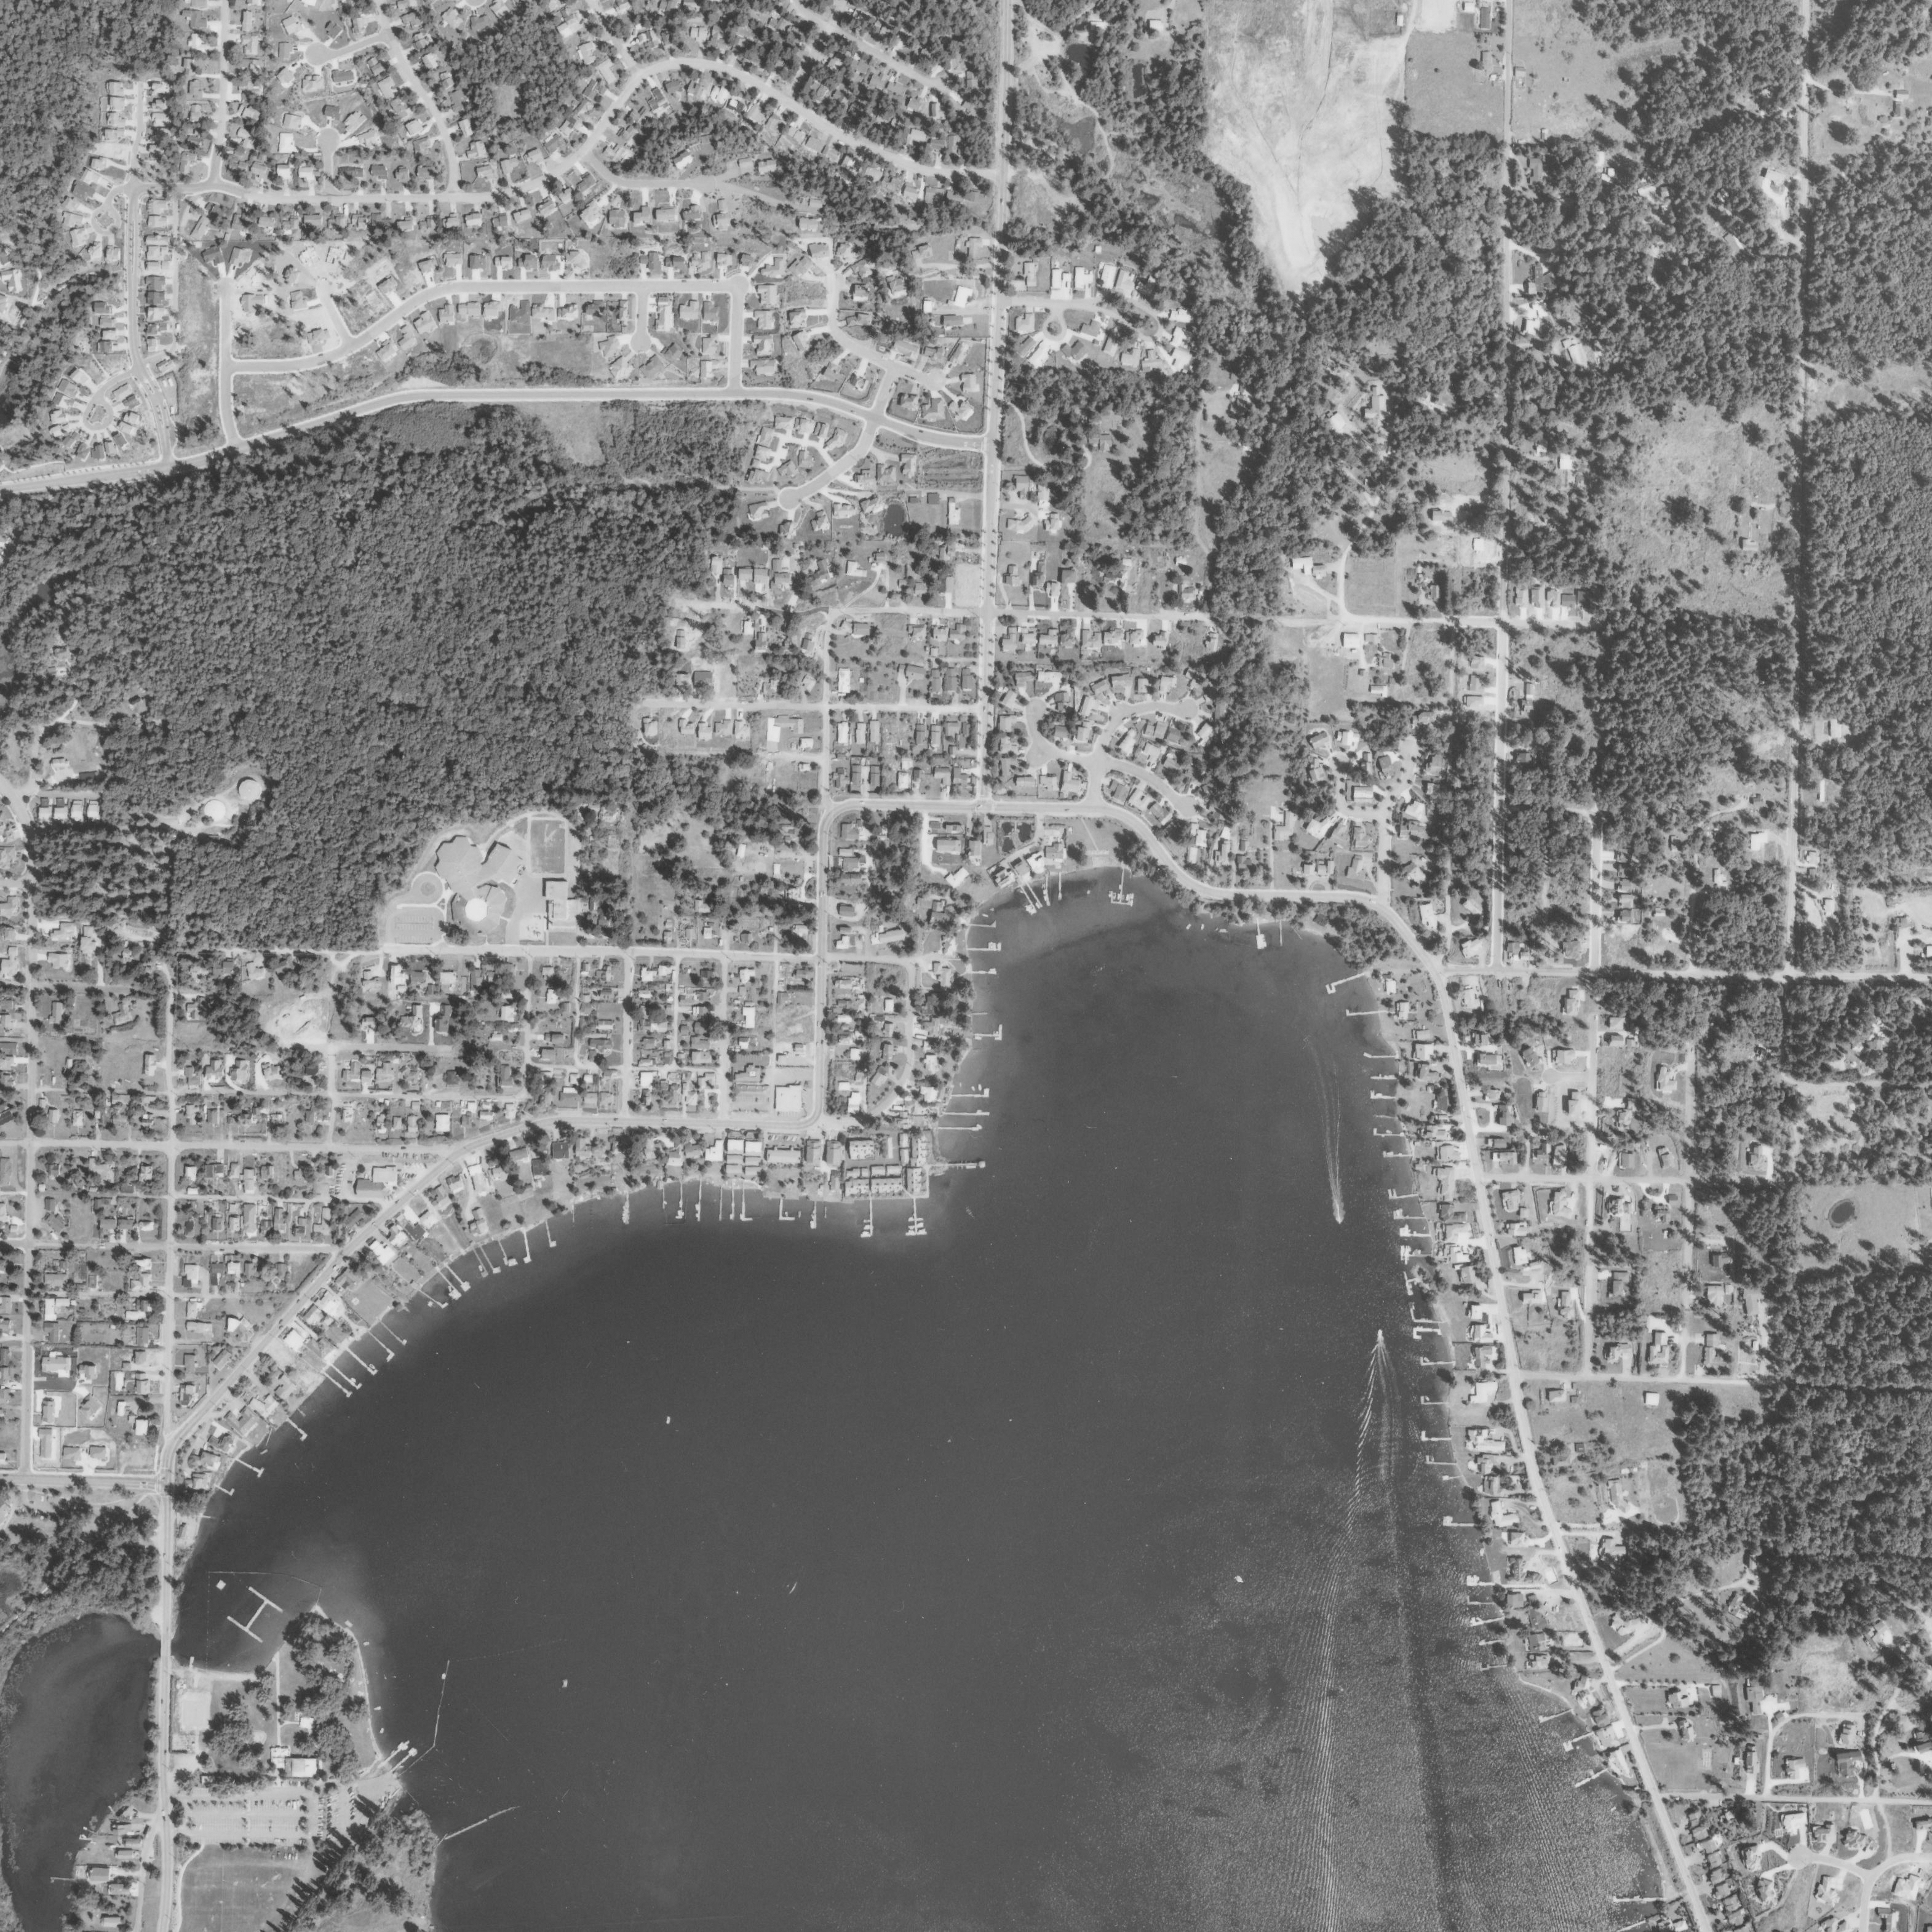
This photo of Basin 1 was taken in 1998. How many docks do you count in this photo? courtesy photo: City of Bellingham
There are approximately 15,000 people living in the Lake Whatcom watershed, with a majority of them living around the northernmost Basin 1 and further west and south around Basin 3 in the Sudden Valley resort community. Luxurious homes interspersed with summer cottages line much of the shoreline, with more stacked in tiers extending to higher elevations in the watershed. Many of the houses have spacious, well-manicured lawns and wide driveways to accommodate numerous vehicles, as well as private docks (see above photo) extending out into the lake to which are tethered boats, jet skis, and other recreational watercraft.
In summer, watercraft of all shapes and sizes litter the surface of the lake as people enjoy its recreational benefits. There is also the occasional floatplane that comes into to land on or take off from the lake, taking advantage of the FAA approved seaplane base located just south of the Sudden Valley resort. Another amenity open to the public in the watershed is the Sudden Valley resort’s 18-hole golf course that has its signature hole abutting the west shore of Basin 3.
When people are informed of where their drinking water comes from, most are shocked and then outraged. The first question they ask is how could the city of subdued excitement, with a reputation for being environmentally conscientious, allow people and pets to recreate in and live around their drinking water source? The next question asked is, just how clean is the water they drink if there are no basic protective safeguards in place to keep people and pets out?
Both questions have fairly simple answers that belie the complex events and processes that created the conditions that exist today. The first question is answered by the cascade of historical events that led to the lake being designated as a drinking water supply source after residential development and commercial activities had already been well established in the watershed. Local politics and human behavior also played contributing roles.
Why Are People Recreating in My Drinking Water?
To summarize, people have been utilizing the Lake Whatcom watershed since the mid-1800s (Peterson, 2008). By the late 1800s, logging, timber production and mining were the primary activities in the watershed, with most of the workers who supported those industries building houses and living nearby. These activities expanded and increased into the 1900s with the population of workers living in the watershed also increasing.
After the merger of Whatcom, Sehome, Bellingham and Fairhaven towns into the city of Bellingham in 1903, Lake Whatcom became the primary source for domestic water (Peterson, 2008). Concerns emerged shortly thereafter about potential impacts to drinking water quality caused by the people living in the watershed. In 1906, the city imposed a stringently enforced ban on swimming in the lake.
By the 1930s, however, the region experienced a population boom with increased residential development of homes and summer cottages in the northwest part of the watershed. Fishing, boating and swimming activities on the lake increased as priorities and interests changed. Protective actions to safeguard the lake from human activities were relaxed and eventually forgotten.
By 1948, all logging and mining activities in the watershed had ended, only to be replaced by increasing residential development and recreational activities which continued unabated into the 1990s. Growing concern about the decline in water quality as evidenced by monitoring data collected since the 1960s eventually led to the formation of the Lake Whatcom Management Committee made up of the county executive, the Bellingham mayor and the manager of the Sudden Valley water district (now the Lake Whatcom Water and Sewer District). The committee developed a draft management plan in 1992, outlining goals and policies to guide all future management actions in the watershed. It has been updated and revised over the decades but remains the guiding document to mitigate the effects of current development and activities on the lake’s water quality.
Is the Water Safe to Drink?
The simple answer is that our drinking water after treatment is in full compliance with the Safe Drinking Water Act., meeting or exceeding all federal and state water quality standards. The quality of Lake Whatcom water, however, does not and has been listed as an impaired water body under section 303(d) of the Clean Water Act.
Annual water quality monitoring funded by the city of Bellingham and conducted by Dr. Robin Matthews and her research team at Western Washington University have provided data clearly showing the decline in several water quality parameters over the last 30 years. In the early 2000s, the rate of deterioration began accelerating to the alarm of city and county officials, the scientists conducting the monitoring, and the general public.
Since then, the Lake Whatcom Management Team has worked to install storm water runoff treatment systems around the heavily populated areas of the watershed. The team has also developed programs to educate watershed homeowners and provide financial incentives to reduce or eliminate impacts on the environment and the lake.
These efforts have helped to reduce the rate of deterioration. In recent years, water quality monitoring data indicate that the rate of decline in several water parameters has slowed and in some cases appear to have stabilized. The data also have revealed, however, that warmer summer temperatures with longer warmer seasonal periods accelerate biological productivity causing severe deleterious chemical changes to water quality. Implementing mitigation efforts now has become an even higher priority given these data results foreshadow additional impacts to the lake as climate change progresses.
What the Data Show
Data in the 2015/2016 Lake Whatcom Monitoring Program Annual Report by Matthews et al. (2017) indicated that the residual effects from the extremely warm and prolonged summer season in 2015 were still evident through most of 2016. The following are the results of some water quality parameters:
Dissolved Oxygen vs. Temperature
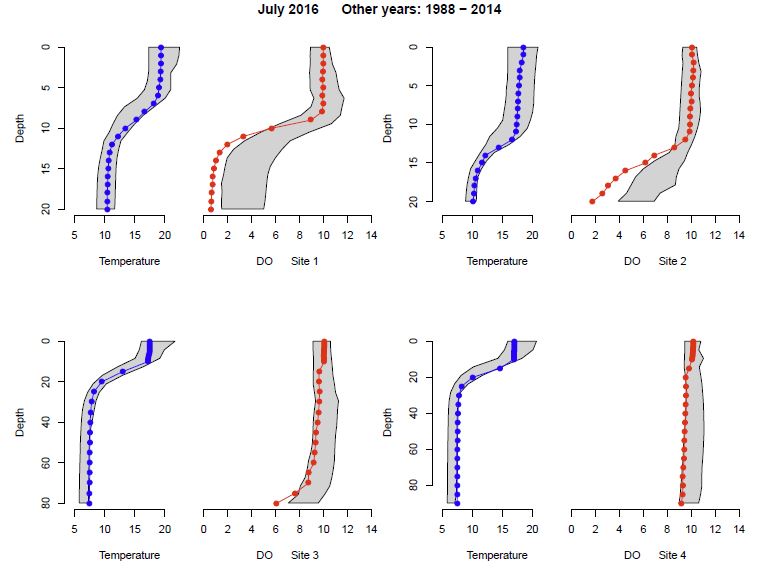
Figure 1. July 2016 temperature (on left) and dissolved oxygen (on right) profiles with depth compared to 1988 through 2014 minimum/maximum ranges (shaded areas).
Temperatures in Basins 1 and 2 were relatively warm, but within historic ranges. Basin 3 of the lake was still unusually warm in June and remained close to historic maximum levels through September (see Figure 1).
Atypical depletion of dissolved oxygen in the cooler bottom (hypolimnetic) water layers of Basins 1, 2 and the northern portion of Basin 3 occurred again during the summer of 2016, but were not as extreme as in 2015 (see Figure 1).
Dissolved Oxygen 1988 through 2016
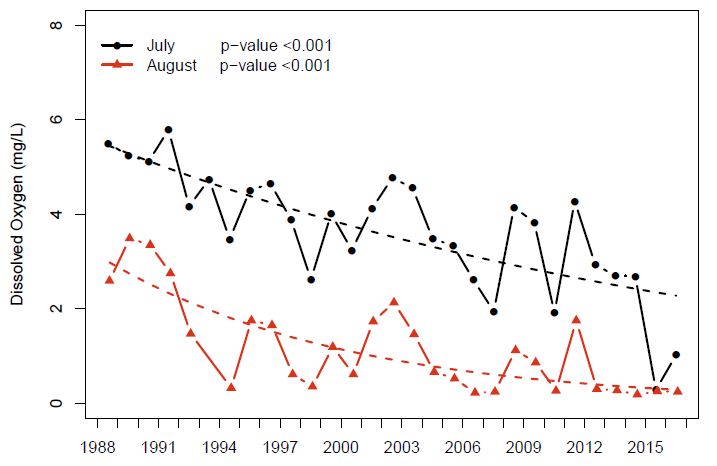
Figure 2. Trends in dissolved oxygen over time in Basin 1 at 14 meters (~46 feet) sampled in July and August from 1988 through 2016 (Matthews et al., 2017).
The rate of oxygen depletion in Basin 1 was again abnormally rapid compared to 1988 through 2014 data, setting up anoxic conditions in May, June and July that were lower than historic minimums (see Figure 2).
Total Phosphorus 1994 through 2016
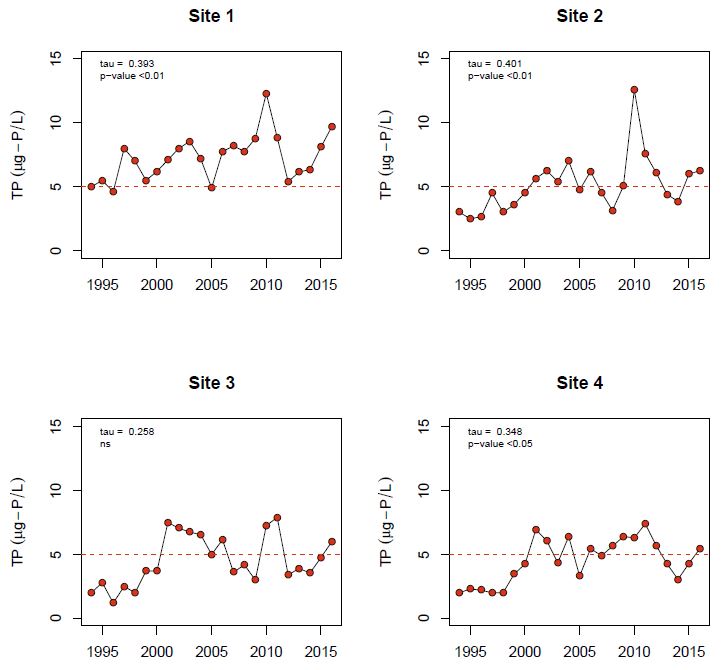
Figure 3. Median summer near-surface total phosphorus concentrations over time at each sampling site from 1994 – 2016 (Matthews et al., 2017).
Total phosphorus (TP) levels increased in all basins (see Figure 3).
Chlorophyll 1994 through 2016
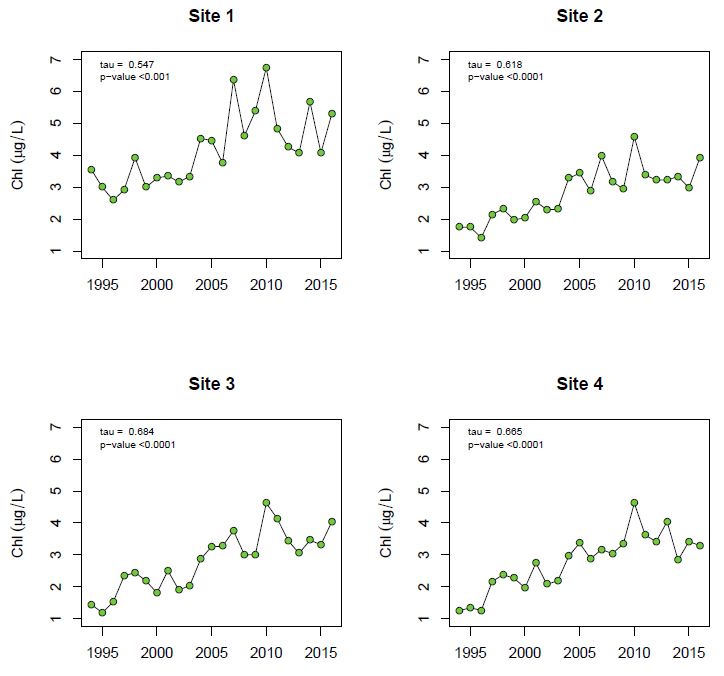
Figure 4. Median summer near-surface chlorophyll concentrations over time at each sampling site from 1994 – 2016 (Matthews et al., 2017).
Chlorophyll (Chl) concentrations increased in all three basins. Only the southern portion of Basin 3 had chlorophyll concentrations that slightly decreased compared to 2015 data (see Figure 4).
Blue-Green Bacteria Cyanobacteria 1994 – 2016
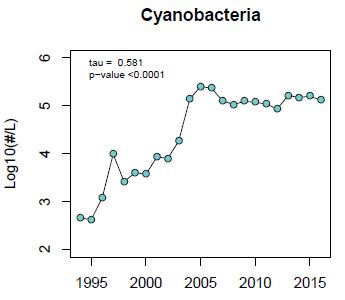
Figure 5. Log 10 plots of median summer near-surface Cyanobacteria counts (1994 – 2016), June through October, all sites and depths (Matthews et al., 2017).
Bluegreen bacteria (Cyanobacteria) populations remain high in all three basins and seem to have stabilized (see Figure 5).
Total Trihalomethane January through December 1991 through 2016
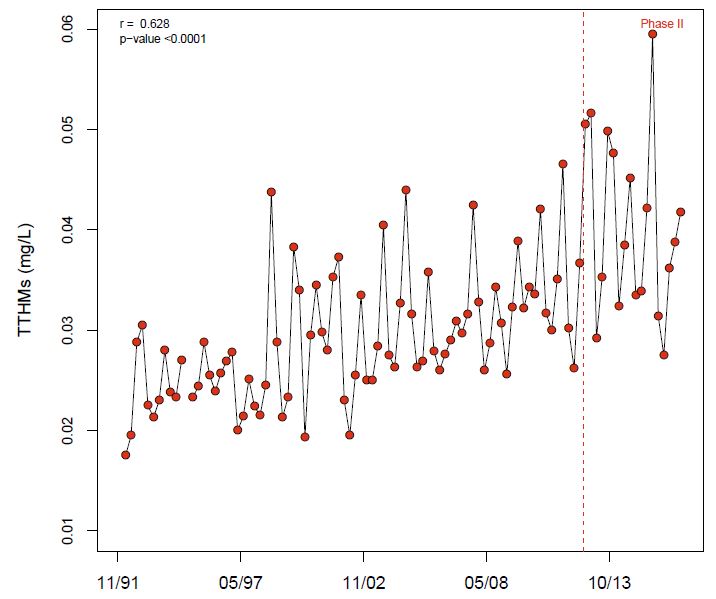
Figure 6. July through September total trihalomethane (TTHM) concentrations in the city of Bellingham’s water distribution system from 1991 – 2016 (Matthews et al., 2017).
Trihalomethanes (THMs), which are known carcinogens created during the disinfection process of water treatment, have decreased overall in tap water to about 0.04 mg/L, down from the high of 0.06 mg/L in 2015 (see Figure 6), and well below the maximum allowable contaminant level of 0.08 mg/L. (Note: The number of sites used to calculate the quarterly averages increased from four to eight in 2012 (vertical dotted line).
What the Data Mean
Biological productivity in the lake continues to be high in Basins 1 and 2 and in the northern portion of Basin 3 at levels equal to or exceeding maximum levels measured between 1988 and 2014. Atypical depletions of dissolved oxygen in the bottom layers of water (see Figures 1 and 2), as well as increased concentrations of chlorophyll a, an indicator of algal biomass, in all three basins (see Figure 4) are key markers of increased productivity. Fueling the biological productivity continues to be increased inputs of phosphorus into all three basins of the lake (see Figure 3) despite stormwater runoff treatment systems installed around the developed areas of the lake, as well as watershed homeowner education and incentive programs. Removing dissolved forms of phosphorus from entering the lake remains problematic.
High biological activity is responsible for creating severe anoxic conditions in the bottom water layers of Basins 1 and 2 in the summer. These anoxic conditions cause the water to become acidic and any metals that had precipitated out of the water column and into sediments are dissolved and released back into the overlying water. Those metals include phosphorus, mercury, lead, iron, cadmium, zinc, etc.
These chemicals are recirculated throughout the lake once water temperatures cool and the water is no longer thermally stratified. In some lakes, this can result in fish kills and cause health officials to issue advisories to those who draw their water directly from those lakes.
Impaired Lake Water, But Clean Drinking Water?
Yes, it is possible to have both. The city of Bellingham has invested a lot of money and resources in its water treatment facility in Whatcom Falls Park. Water is withdrawn from Basin 2 and processed through a series of treatment steps at the facility that include filtering, adding chemicals to remove smaller suspended particles and algal cells, adjusting the pH and adding chlorine for disinfection. These steps produce high quality drinking water that is in full compliance with the Safe Drinking Water Act standards.
The more degraded the lake water, however, the more treatment is needed to clean it to levels safe for drinking. The city is already in the process of building a new $15 million water pretreatment system that should be online in 2018 (Wohlfeil, 2015). The new facility will feature a dissolved air floatation system that will use microscopic air bubbles to attach to any oils or other organic matter in the lake water and float them to the surface where they can be easily skimmed off. The end result promises to be clearer water that is then sent to the existing plant for full treatment.
The downside of relying on treatment processes to clean up source water is that one or more of the steps in the treatment process may become compromised or fail, potentially resulting in thousands of people getting sick before the problem is found. All the more reason that the city, county and the Lake Whatcom Water and Sewer District, as well as the people living in the watershed, must continue their efforts to reduce and eventually eliminate phosphorus loading to the lake.
Our community’s future depends on actively protecting and preserving Lake Whatcom as our source of drinking water and never taking this precious resource for granted.
_________________________________________
April Markiewicz is a toxicologist and the associate director at the Institute of Environmental Toxicology at Huxley College of the Environment at Western Washington University, as well as president of the People for Lake Whatcom Coalition.