by Eric Hirst
There is less water during the summer in the Nooksack River today than five decades ago. These lower flows are one of many factors adversely affecting salmon and the orcas that feed on salmon. (1) This paper documents the decline in flows and shows that human use of water accounts for an important part of this flow.
Results
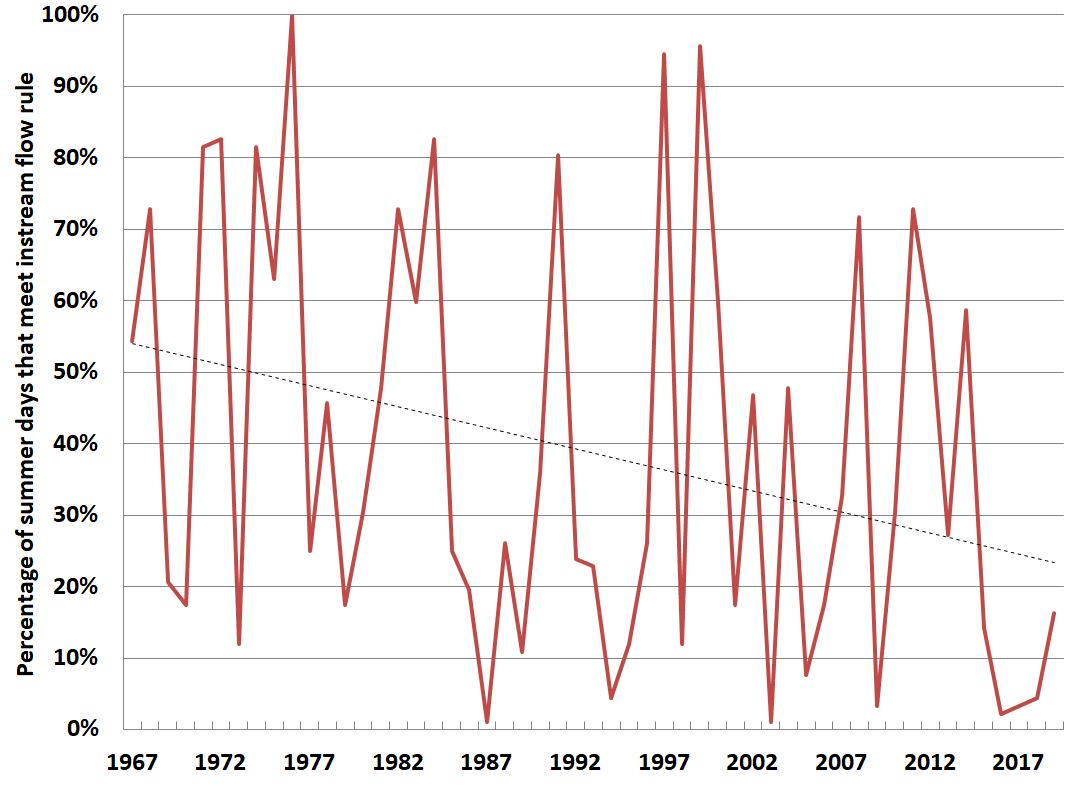
I focus on summer because that is when flows are the lowest, salmon and other wildlife are most likely to need more water than is actually flowing, and human use of water is greatest (primarily because of agricultural irrigation). Over the past 53 years (1967 through 2019), summer streamflow, measured by the U.S. Geological Survey in Ferndale, has been declining (Fig. 1).
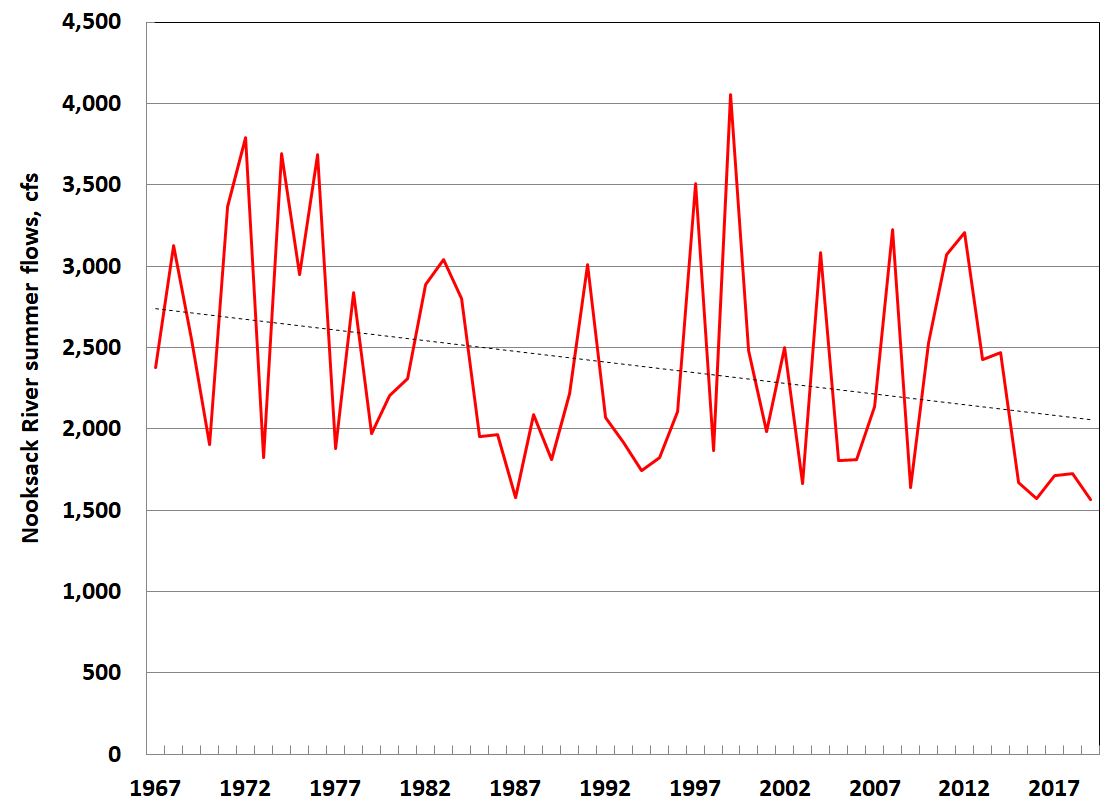
Fig. 1. Nooksack River summer streamflow at Ferndale, in cubic feet per second (cfs). Summer includes July, August, and September.
Over this period, flows decreased at an average of 0.5 percent per year. However, this adverse trend is accelerating: during the past 10 years, flows declined by 8.0 percent per year.
How much water do salmon and other wildlife need? The only official answer to that question is the 1985 instream flow rule issued by the Washington State Dept. of Ecology (Ecology). (2) This rule established minimum flows for about 30 location points in the Nooksack River basin. (3) During this 53-year period, summer flows often fell below the Ecology minima (Fig. 2).
The situation is getting worse, with lower and lower flows that fail to meet the minimum more and more days: during the past 10 years, flows were below the Ecology minima for 71 percent of the days, compared with only 59 percent for the 1967-2009 period. This worsening trend is likely a consequence of climate change (i.e., smaller glaciers, (4) less snowfall, earlier springtime snowmelt, and less summer rain).
The substantial year-to-year variability in streamflow may obscure the long-term trend.

Fig. 3. Average daily summer flows in the Nooksack River for two periods: 1967 through 2009 and 2010 through 2019. The solid line is the minimum flow set in Ecology’s rule.
Fig. 3 displays these data in a different way. It shows how much lower (10 percent) summer flows have been during the past decade compared with the prior 43 years. During the earlier period, flows were higher than those set in Ecology’s rule 41 percent of the days; during the last decade, flows exceeded the Ecology levels only 29 percent of the time. (The solid line in Fig. 3 shows the minimum flows set by Ecology.)
The Climate Toolbox provides estimates of future streamflows, based on the likely effects of climate change.(5) For example, from 2040-2069, flows are likely to be above the Ecology levels for only 16% of the days, compared with 29% during the past decade.
To what extent are these low flows caused by out-of-stream human uses, i.e., for residential commercial, industrial, and — especially — agricultural uses? To estimate the potential benefits of reducing human water use, I “added” 200 cubic feet per second (cfs) to all the daily flows (Fig. 4), consistent with the Lower Nooksack Water Budget Overview. (6)

Fig. 4. Average daily summer flows in the Nooksack River, 2010 – 2019, with 200 cfs “added” to these flows, and Ecology’s instream flow rule.
“Eliminating” all human out-of-stream consumptive water use would increase summer flows by 9 percent over the past decade. The increased flow would substantially improve compliance with the instream flow rule: from 29 percent of the days to 38 percent. Clearly, we can’t eliminate human water use, but this simple example suggests that improving efficiency of water use can increase streamflows and improve compliance with the instream flow rule.
Conclusions
The simple analysis conducted here for one location on the Nooksack River should be repeated for each of the three forks and several lower Nooksack tributaries to see whether the present results and conclusions are valid throughout the watershed.
My views, based on these results and prior analysis, are: (7)
Absent prompt and substantial action, Nooksack River summer flows will continue to decline, adversely affecting salmon and other wildlife. Low flows lead to higher water temperatures, less dissolved oxygen, and less instream habitat, all of which make life more challenging for fish. These declines are caused primarily by climate change and secondarily by human use of water.
What can we do to increase flows? We need to identify a suitable mix of projects that increase water supplies and that improve the efficiency with which we use water. By suitable, I mean a set of projects that are affordable, cost-effective, environmentally benign, likely to be approved by regulatory agencies, and politically feasible.
The last criterion (politically feasible) might be the most important. We need to press our local government leaders, especially the Whatcom County Executive and County Council, about their plans to address this critical issue. The recently approved Implementation Strategy is a step in the right direction; (8) we need to hold the Watershed Management Board accountable for meeting the goals in the plan.
Endnotes
1. Some of the other factors affecting salmon health and numbers include water quality, loss of habitat, fish-passage barriers, logging, and ocean conditions.
2. Washington State Dept. of Ecology, Nooksack Instream Resource Protection Program (Water Resource Inventory Area 1), Nov. 1985. The rule was completed in 1985 and went into effect in early 1986 and was amended in 1988.
3. This rule did not require any reductions in existing water use and therefore did not increase flows in the Nooksack basin. It did prevent new (post-1985) uses of water that would have lowered flows below the levels set by Ecology.
4. Paradoxically, shrinking glaciers will lead to increased summer flows over the next few decades, after which glacier loss and disappearance will cause even greater declines in summer flows.
5. https://climate.northwestknowledge.net/NWTOOLBOX/tribalProjections.php
6. C. Bandaragoda et al., Lower Nooksack Water Budget Overview, 2012; see Figs. 15 and 16.
7. E. Hirst, “Whatcom Water: Problems and Prospects,” Cascadia Weekly, 13(50), Dec. 12, 2018.
8. WRIA 1 Watershed Management Board, 2018-2023 Implementation Strategy August 1, 2018, Sept. 2019.
____________________________
Eric Hirst moved to Bellingham in 2002. He has a Ph.D. in engineering from Stanford University, worked at Oak Ridge National Laboratory for 30 years as a policy analyst on energy efficiency and the structure of the electricity industry. He spent the last eight years of his career as a consultant. In Bellingham, he has continued his work as an environmental analyst and activist.

