by April Markiewicz
Editor’s Note: This is the 20th article April Markiewicz has written about the Lake Whatcom Monitoring Project for Whatcom Watch. The Lake Whatcom Monitoring Project was initiated in the 1980s to measure and track long-term lake data for temperature, pH, dissolved oxygen, conductivity, turbidity, and nutrients, including nitrogen and phosphorus. The work is performed by WWU’s Institute for Watershed Studies and funded by the city of Bellingham.
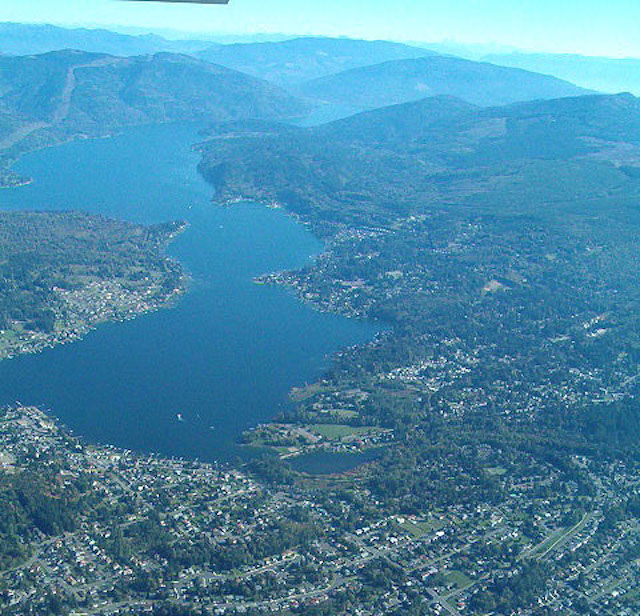
Lake Whatcom
photo: April Markiewicz
In early March of this year, visitors to Lake Padden Park, located off Samish Way in south Bellingham, were alarmed to see the surface of Lake Padden a “vibrantly green” color. The coloration of the water was so intense that many of the public thought the cause was from someone illegally dumping paint into the lake. Alarmed phone calls and complaints to the City of Bellingham (COB) resulted, with enough public outcry, that the incident was reported in The Bellingham Herald newspaper. The cause, however, was not directly from human misconduct, but rather from a naturally occurring source, i.e., the prolific growth of Cyanobacteria in the nutrient-enriched lake water.
City officials responded quickly to caution people visiting Lake Padden Park, especially those with children and pets, to avoid all contact with the lake, as well as Padden Creek, while they investigated. The primary concern was whether the Cyanobacteria included species that produce toxins harmful to wildlife, waterfowl, pets, and humans.
According to the World Health Organization (WHO, 2019), the toxins produced by certain species of Cyanobacteria can target the liver or kidney, whereas others target the nervous system or gastrointestinal tract. Symptoms can range from general nausea to those requiring intensive hospital care and possibly resulting in death. According to the Centers for Disease Control and Prevention (CDC, 2023), there are no specific antidotes for these toxins or the illnesses caused by the Cyanobacterial organisms in humans. Treatment is therefore mainly to support the patient and is directed by the symptoms of the type of toxin poisoning (CDC, 2023).
Fortunately, further taxonomic analyses of the samples found no toxin-producing species in Padden Creek and Lake Padden water. The city has hired a specialist, however, to tour the park and help identify where the nutrients (mainly phosphorus and nitrogen) are coming from in the surrounding watershed that are promoting the growth of these species. Potential sources include human recreational activities in the Lake Padden watershed (swimming, boating, biking, hiking), pets and pet waste, soil erosion and leaf litter from the south and southwest wooded areas around the lake, as well as leaking sewer lines, to name a few.
At this point, you might be asking yourself, “Why is this article discussing Lake Padden when the article is supposed to be about the status of water quality in Lake Whatcom, our community’s primary drinking water source?” The reason is that Lake Padden is merely a smaller version of Lake Whatcom, and, what we see happening in Lake Padden is occurring in Lake Whatcom. The difference is the impacts in Lake Whatcom are not as visible to the general public and have therefore not triggered the same public alarm and response.
Regardless of what we see or don’t see, Lake Whatcom’s water quality has been in decline according to the data that have been collected, at first sporadically, and then on more regular basis over the last 60-plus years. In 1987, the City of Bellingham formalized annual monitoring of Lake Whatcom’s water quality by contracting with Western Washington University’s (Western’s) Institute for Watershed Studies to conduct those studies to the present day. Dr Robin Matthews and now Dr. Angela Strecker have lead those studies of Lake Whatcom with support from staff and other faculty at Western.
About Lake Whatcom
Lake Whatcom is our community’s main source of drinking water, supplying water to approximately 100,000 residents not only in the City of Bellingham, but throughout Whatcom County. Lake Whatcom is comprised of three basins, and was created by the scouring action of retreating glaciers 10,000-plus years ago. It encompasses an area of 5,000 acres (7,817 miles) with a maximum depth of 350 feet and contains approximately 250 billion gallons of water (COB, 2023b).
Prior to it becoming our dedicated drinking water source in 1968, Lake Whatcom and its watershed was a bountiful natural resource that was exploited for fishing, recreation, mining, and logging for over 100 years (Geneva Consulting, 2008). Unfortunately, recreational activities, logging, and urban development in the watershed have been allowed to continue to the present. As such, the lake and its watershed were never subject to the same protections from human activities that almost all drinking water sources around the world have received.
For comparison, one need look no further than Lake Padden, that was our community’s dedicated drinking water source up until the 1960s. Remnants of fencing can still be found around the perimeter of the lake that served to protect it from human activities. Even today, there is no urban development around its shorelines, no motorized watercraft allowed on the lake, and no logging or mining in its watershed, yet it still has poor water quality despite those historical protections.
Granted, Lake Padden and its watershed are much smaller than Lake Whatcom’s. It is man-made, encompasses an area of about 160 acres with a maximum depth of 59 feet, and contains approximately 1.4 billion gallons of water (0.6 percent of the volume in Lake Whatcom). With protections in place, however, it was able to provide water to our community for over several decades.
Conversely, the lack of any protections for Lake Whatcom and its surrounding watershed over the last 150 plus years have caused profound deleterious effects. We have accelerated the aging process in the lake, making it much more biologically productive. Aquatic species’ compositions and interactions have been altered as well. In 1998, the lake was listed as an “impaired” waterbody under Section 303(d) of the federal Clean Water Act by the Washington State Department of Ecology (Ecology).
The reason was for low dissolved oxygen caused by excess inputs of phosphorus and nitrogen into the lake. By 2007, the lake was reclassified as a “mesotrophic” or nutrient-polluted lake (Matthews et al., 2007). Obviously, sufficient actions were not taken in the following eight years by our community to halt the decline in water quality after the lake was first listed as impaired. Now, actions are being taken, however we are 25 years behind schedule. Moreover, there are now more than 18,000 people living in the watershed (2018 estimate) (COB, 2023b) and urban development continues to be allowed.
For example, just recently COB released its 2023 “Lake Whatcom Watershed Annual Buildout Analysis Report” (COB, 2023a). According to the data there are 7,214 existing dwelling units in the watershed with an additional 3,336 developable (vacant acres) in the watershed. Of those developable acres, there is the potential to build 1,370 more units in the watershed, allowing thousands more people to live in the watershed.
What the Data Show
The most recent Lake Whatcom Monitoring Program Annual Report for 2021/2022 by Strecker et al. (2023) does show some signs that the lake may be stabilizing as nutrient inputs have been addressed with improved stormwater treatment systems. Educating residents in the watershed about actions they can take to reduce nutrient loadings to the lake has probably also helped. Water quality conditions in the lake in 2022 were as follows:
• Due to the unseasonably cold spring and early summer weather in 2022, thermal stratification in basins 1 and 2 was delayed until late May and was not fully stable until almost September.
• DO (dissolved oxygen) concentrations were therefore depleted at a slower rate in basins 1 and 2 due to the delayed thermal stratification in the two subbasins. By July, DO levels at 14 meters deep in basin 1 were still slightly above 4 mg DO/L that is required for fish survival. By August, however, concentrations were below 2 mg DO/L and by September at 0 mg DO/L (see Figure 1).
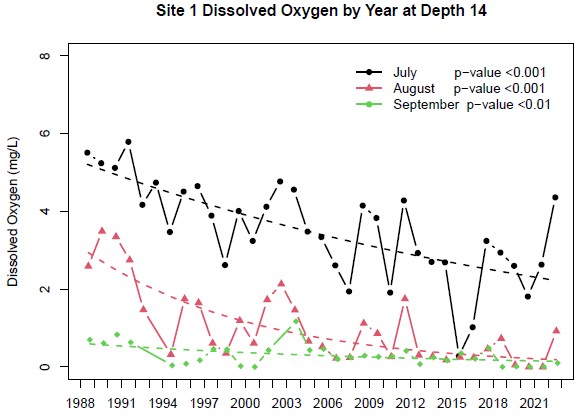
Figure 1. Trends in dissolved oxygen over time in basin 1 at 14 meters (~46 feet) sampled in July, August, and September from 1988 through 2022 (Strecker et al., 2023).
• Chlorophyll (Chl) concentrations, a direct measure of algal biomass and indicator of a lake’s biological productivity, appear to have leveled off since 2010 (see Figure 2 ).
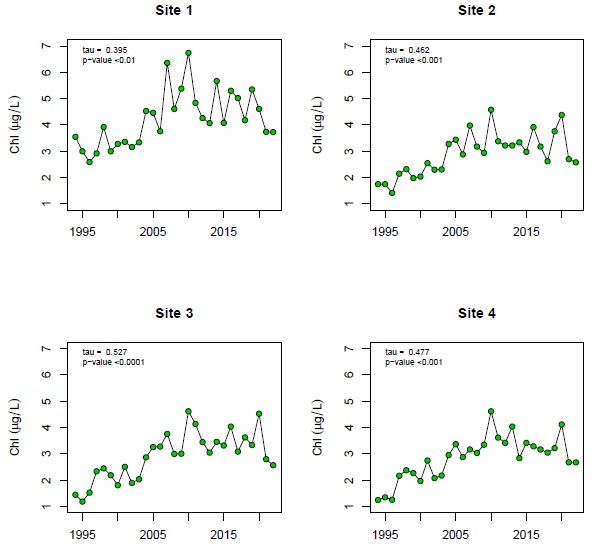
Figure 2. Median summer near-surface chlorophyll concentrations (June – October) at each sampling site from 1994 – 2022 (Strecker et al., 2023).
• Green algae (Chlorophyta) and Cyanobacteria numbers, in general, are continuing to increase throughout the lake compared to previous year’s data (see Figures 3 and 4); however, last year’s cold temperatures did reduce their numbers.
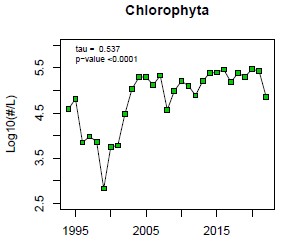
Figure 3. Log10 plots of median summer near-surface green algae (Chlorophyta) counts from June through October all sites and depths (1994 – 2022) (Strecker et al., 2023).
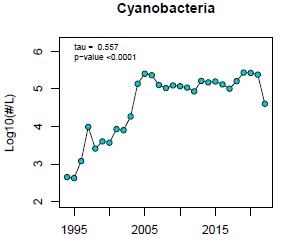
Figure 4. Log10 plots of median summer near-surface Cyanobacteria counts for each site (June – October) from 1994 – 2022 (Strecker et al., 2023).
• Total phosphorus (TP) in the surface waters was still measurable in basin 1, indicating potential ongoing inputs into the basin. In basins 2 and 3, however, TP was below analytical detection limits, indicating potentially less inputs, as well as rapid biological uptake and utilization (see Figure 5).
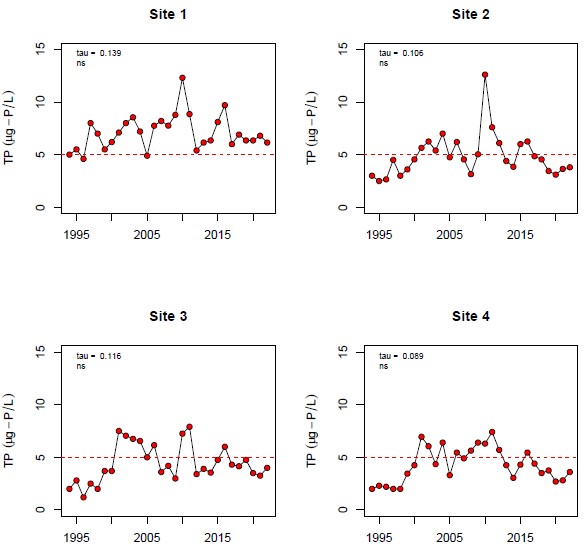
Figure 5. Median summer near-surface total phosphorus concentrations at each sampling site from 1994 – 2022 (Strecker et al., 2023).
• Dissolved inorganic nitrogen (DIN) concentrations in the surface waters continue to rapidly decline and by June were below analytical detection limits (see Figure 6).
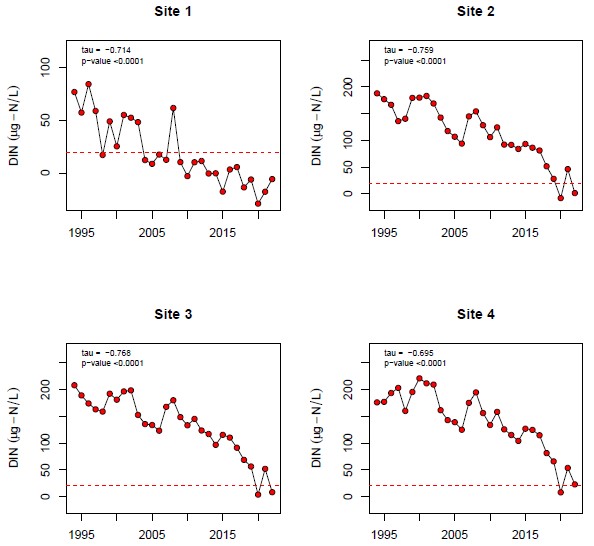
Figure 6. Minimum summer near-surface dissolved inorganic nitrogen (DIN) concentrations at each sampling site from (June – October) 1994 – 2022 (Strecker et al., 2023).
Additional analyses of the DIN data, comparing spring versus summer DIN concentrations found that summer utilization rates are continuing to accelerate and outpace spring rates (see Figure 7).
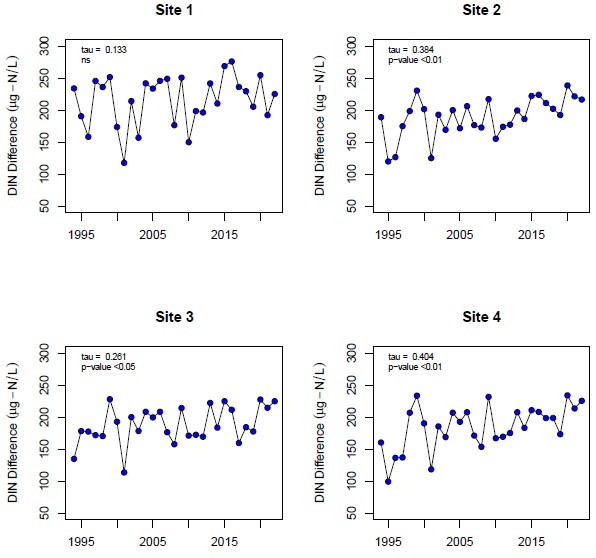
Figure 7. Differences between median spring (Feb-May) and summer (June-Oct) near-surface dissolved inorganic nitrogen (DIN) concentra- tions (Strecker et al., 2023).
What We Know and Don’t Know
We know from studies conducted over the last 60-plus years, that, in conjunction with excess nutrients, other contaminants have entered the lake. They include metals (lead, mercury, arsenic), pesticides, fertilizers, gasoline (from personal watercraft: jet skis, motorboats, etc. and float planes) and legacy (banned) chemicals. The primary source has been via stormwater runoff from urban development, roadways, and other impervious surfaces in the watershed.
What we don’t know is whether personal care products and pharmaceuticals are also in the lake water. We have 60-plus years of water quality data, but very little data on emerging chemicals of concern that may be in our drinking water source. It is obvious, however, that, with the culmination of historical and ongoing present-day activities in the Lake Whatcom watershed, significant impacts to the lake’s water quality have taken place. Furthermore, we know the degradation of the lake’s water quality will continue because human activities in the watershed continue unabated.
Why Should We Care?
To assume or propose that more urban development in the watershed will not have an impact on the lake’s water quality is naïve at best, and based on the erroneous viewpoint that we humans have a right to use the natural resources around us for our own benefit. If we damage or destroy an ecosystem, cause species to go extinct, or pollute an entire planet, we believe we have the wherewithal to “fix” the problem with our superior skills and technological tools.
It is just basic common sense that if your actions have caused harm to the environment, resident species, your community, family, or friends, you need to stop those actions. Therefore, all development in the watershed should have been stopped at least 25 years ago as the water quality in the lake showed obvious signs of accelerated decline and as the lake transitioned to be much more biologically productive. As a community, we are now faced with paying the financial price for our inactions. All of us have had to pay millions of dollars in taxes to get treatment systems installed around the lake. Yet, water quality continues to degrade.
What Do the Data Mean?
Most of the 2021/2022 water quality data were within historical norms, except for surface water temperatures in basin 2 from June through August of 2022. Overall, the data indicate that biological productivity in Lake Whatcom is still gradually increasing over time, resulting in impaired water quality conditions especially during the warmer summer months.
Current management efforts may be helping to keep productivity levels in the lake from being much higher. Cyanobacteria, however, appear to be increasing each year throughout the lake. When factored in with the accelerated decline in DIN each year, lake conditions are becoming increasingly favorable for the growth of Cyanobacteria, similar to what is occurring in Lake Padden each year.
Where Do We Go From Here?
So, will Lake Whatcom become like Lake Padden in the future? Ecology is providing regulatory oversight to ensure that the Lake Whatcom Management Team, consisting of the City, County, and the Lake Whatcom Water and Sewer District, as well as watershed residents are diligent in reducing nutrient loadings to the lake.
There is already a Total Maximum Daily Load (TMDL) reassessment taking place to further reduce nutrient loadings to the lake. The updated TMDL is scheduled to be submitted to the Ecology on March 31, 2024. According to the most recent presentation by the Lake Whatcom Joint Councils and Commission (JCC, 2023), 920 to 1,100 “effective developed acres” have been reduced in the watershed over the last 30 years.
Effective developed acres are defined as “developed acres that have been retrofitted to mimic forested runoff conditions” (JCC, 2023). The goal is to retrofit a total of 3,500 acres. At the current rate of retrofitting, approximately 1,000 acres over 30 years, that equates to at least another 75 years needed to reach that goal. The key assumption being that the same efforts and efficiencies in retrofitting developed acres will be attained each year, even though more development in the watershed is allowed to continue.
More troubling is we don’t know the amount of phosphorus coming from these retrofitted areas. Have we verified these areas now mimic forested runoff conditions during storm events, i.e., is there monitoring of stormwater runoff from these retrofitted properties? Maybe our only clue will be seeing more frequent or vibrantly green Cyanobacteria blooms in Lake Whatcom, like those currently seen in Lake Padden.
If our community is so passionate about water quality conditions in Lake Padden, the same should be for Lake Whatcom. We don’t have the luxury of finding another drinking water source. Moreover, the proposed timeline for addressing water quality conditions in Lake Whatcom is unacceptable. The longer we take, the more expensive it will be to all of us, financially and health-wise. We are long overdue in making changes now.
Starting with 1991/1992, the monitoring project reports can be accessed at: https://cedar.wwu.edu/lakewhat_annualreps/. Whatcom Watch articles from 2004 to 2015 can be accessed at: http://www.whatcomwatch.org/php/search.php. Type only put the last name Markiewicz in the search box, select author from the pull-down menu. Whatcom Watch articles since 2015 can be accessed at: https://whatcomwatch.org. Type Markiewicz in the search box. If the entire name is put in the search box, you need to put quotation marks around the name.
References
• CDC (Centers for Disease Control and Prevention). 2023. Facts about Cyanobacterial Blooms for the Poison Center Professionals. Accessed 03/24/2023 at: Facts about Cyanobacterial Blooms for Poison Center Professionals | CDC.
• COB (City of Bellingham). 2023a. Lake Whatcom Watershed Annual Buildout Analysis Report 2023. Planning & Community Development Department, Public Works, Natural Resources Division. 8pp. Available at: LWWS_REPORT_2023.pdf – Google Drive.
• COB (City of Bellingham). 2023b. Lake Whatcom Reservoir, Reservoir Facts and Information. Department, Public Works, Natural Resources and Environment. Available at: Reservoir Facts and Information – City of Bellingham (cob.org).
• Geneva Consulting. 2008. The Lake Whatcom Watershed – A Retrospective Resource Directory 1850 – 2007). Prepared for: Whatcom County Public Works, Stormwater Division, Bellingham, WA. March 25, 2008.
• JCC (Lake Whatcom Joint Councils and Commission). 2023. Lake Whatcom Management Program Annual Review Presentation, March 29, 2023. 33pp. Available online at https://drive.google.com/file/d/1gSDvk81RDKEMkUVKN_yaCAh-diqoAVob/view.
• Matthews, R.A., M. Hilles, J. Vandersypen, R.J. Mitchell and G.B. Matthews. 2007. Lake Whatcom Monitoring Project 2005/2006 Final Report. Western Washington University. 496pp. Available online at https://cedar.wwu.edu/lakewhat_annualreps/9/.
• Strecker, A, M. Hilles, J. Pickens, K. Queen, E. Flarry, R. Mitchell, R.A. Matthews, and G.B. Matthews. 2023. Lake Whatcom Monitoring Project 2021/2022 Report. Western Washington University. Lake Whatcom Annual Reports 31. 351pp. Available online at: https://cedar.wwu.edu/lakewhat_annualreps/31.
• World Health Organization (WHO). 2019. Water-related Diseases: Cyanobacterial Toxins. Accessed 04/01/2019 at https://www.who.int/water_sanitation_health/diseases-risks/diseases/Cyanobacteria/en/.
____________________
April Markiewicz is a toxicologist and recently retired as the associate director at the Institute of Environmental Toxicology at the College of the Environment at Western Washington University. She is also the president of the People for Lake Whatcom Coalition.