Whatcom County faces a variety of water supply, water quality and fish habitat problems. Understanding and resolving these problems require a detailed and accurate knowledge of who uses water, for what purposes and when. Irrigation is the largest – and least documented – water use in the county. This article analyzes water use by crop and month and provides new product and temporal details. Unfortunately, like all other numbers on irrigation water use, these are estimates because metered data on actual water use are not available.
Methodology (1)
I used crop-specific evapotranspiration (ET) coefficients from Washington State University.(2) I used estimates for 2014 of the number of irrigated acres by crop and type of irrigation equipment used (drip, sprinkler, or big gun) from Whatcom Conservation District (WCD).(3) Using estimates of equipment efficiency from the Natural Resources Conservation Service (NRCS), I calculated average irrigation efficiencies for each crop. I obtained data on monthly precipitation for the Clearbrook weather station and converted inches of rainfall into inches of irrigation using estimates from NRCS. (4)
Results
Hay/silage dominates irrigated acres in Whatcom County, accounting for almost 40 percent of the 36,000 acre total. Its ET is highest and the equipment used to irrigate hay/silage is relatively inefficient, which explains its accounting for almost half of all water used for irrigation. Raspberries, blueberries and corn are also important users of land and water.
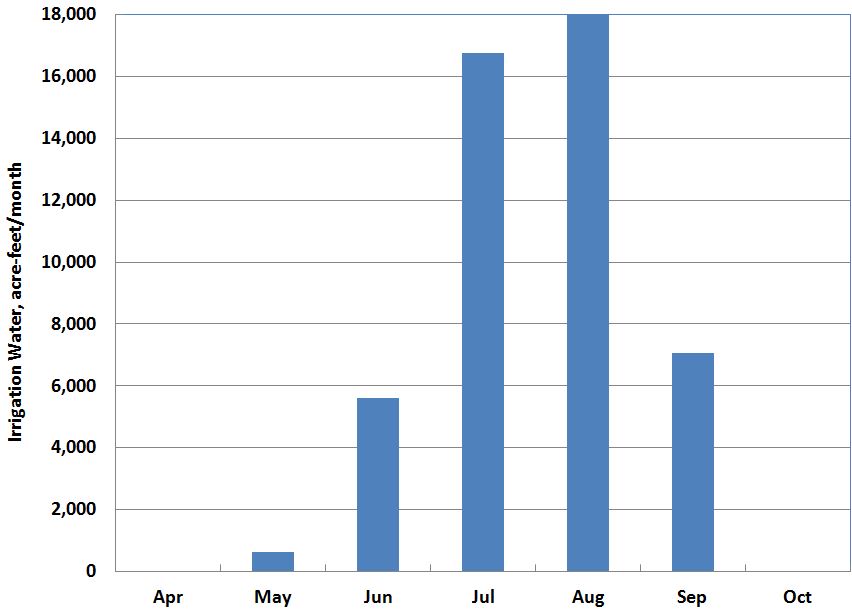
Figure 1. Whatcom irrigation water use, acre-feet/month.
Although these crops require water for all months from April through October, rainfall is sufficient to eliminate the need for irrigation during April and October (Figure 1).
July and August are the most water-intensive months. The three summer months of July, August and September account for 87 percent of the county’s total annual water use. Summer is most critical for salmon and other wildlife and Nooksack River flows are at their lowest, which means the Department of Ecology’s Instream Flow Rule is not met on 62 percent of the summer days. (5)
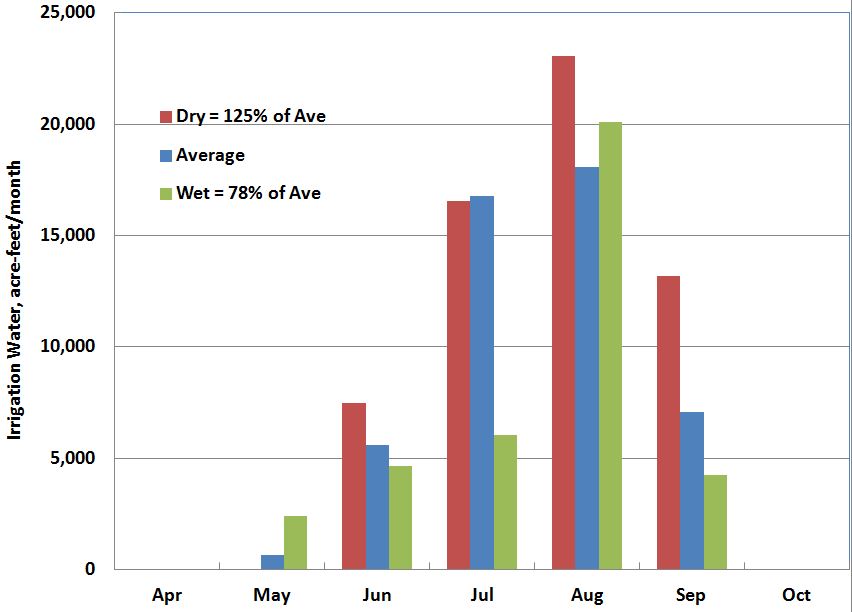
Figure 2. Irrigation water use for dry, average and wet years, acre-feet/month.
These results are for an average year, defined by rainfall. What is different in unusually wet or dry years? Irrigation water use is 25 percent higher during the dry years and 22 percent lower during the wet years than the average (Figure 2).(6) The fraction of water used during the summer is similar across all three cases. However, the percentage of days that the Instream Flow Rule is not met is quite different: 87, 62, and 40 for the dry, average, and wet years. Irrigation water use, therefore, is greatest when stream flows are lowest and fish most need abundant water.
I combined these estimates of irrigation water use with estimates for other sectors (primarily residential, commercial, industrial and livestock) to refine values for total Whatcom County water and the share allocated to irrigation. Total water use amounts to 36 billion gallons a year, of which 44 percent is for irrigation. Summer water use totals 19 billion gallons, of which 70 percent is for irrigation.
Conclusions
The estimates developed here show that Hay/silage accounts for almost half the irrigation water used in Whatcom County. Irrigation, overall, accounts for 70 percent of the county’s total summer water use.
Unfortunately, these estimates, although detailed and precise, are still just estimates. Because water use for irrigation is either not metered or metered but not publicly available, it is not possible to measure actual water use. “Water may be the most important item in our lives, our economy and our landscape about which we know the least. We not only don’t tabulate our water use every hour or every day, we don’t do it every month, or even every year.” (7)
Endnotes
(1) For details on data sources and methodology, see the appendix of E. Hirst, “Whatcom Irrigation Water Use,” Whatcom Watch, May 2016: http://whatcomwatch.org/index.php/article/state-water-resource-data-crucial-for-best-management-2/
(2) R.T. Peters, L. Nelson, and T. Karimi, Consumptive Use and Irrigation Water Requirements for Washington, Washington State University, 2012. “Crop water use is composed of the water evaporated from wet soil and leaves and transpired through the leaves of the plant. Together these are called evapotranspiration (ET) and represent the amount of water that is required to grow and maintain healthy plants.”
(3) A. Phay, personal communication, March 24, 2016, Whatcom Conservation District; see http://agr.wa.gov/pestfert/natresources/aglanduse.aspx.
(4) I am glad to share the Excel workbook I created to develop these estimates of crop-specific irrigation water use.
(5) Dept. of Ecology, Instream Resources Protection Program –Nooksack Water Resource Inventory Area (WRIA) 1, Chapter 173-501 WAC, June 1988. For more detail, see Appendix A of E. Hirst, Whatcom Water Problems and Possible Solutions, May 2015.
(6) I chose 1998 as the dry year because summer rainfall at Clearbrook was lowest that year over the 30-year period from 1976 through 2015. Similarly 1983 is the wet year. This definition of wet/dry does not account for air temperature, solar insolation, wind speed or other factors that might affect crop water use.
(7) C. Fishman, “Water Is Broken. Data Can Fix It,” The New York Times, March 17, 2016.
__________________________________
Eric Hirst moved to Bellingham in 2002. He has a Ph.D. in engineering from Stanford
University, taught at Tuskegee Institute (a black college in Alabama) for two years, and then for 30 years worked at the Oak Ridge National Laboratory as a policy analyst on
energy efficiency and the structure of the electricity industry. Eric spent the last eight
years of his career as a consultant.