by Ray Kamada
I suspect most Whatcom Watchers believe that the current global warming/climate change era is real and mostly man-made. They also seem to know that the main source of global warming is excess greenhouse gas from fossil fuels. Many also grasp that, like an insulating blanket, greenhouse gasses retard outgoing heat by absorbing and downwardly re-emitting some of the heat that wells up from the Earth’s surface as infrared radiation.
Yet, while most skeptics continue to claim, wrongly, that our climate change era is just due to natural variations, it’s the really undeniable events, such as extreme weather, that have caused some doubters to change their minds lately. (1) So, it’s not that we still don’t get far more record highs than lows; we do. (2) But how is it that man-made global warming can cause days or even weeks of being way too hot, too wet, too dry, or even too cold? And, that last one does seem problematically counter-intuitive, doesn’t it?
If You Google the Question …
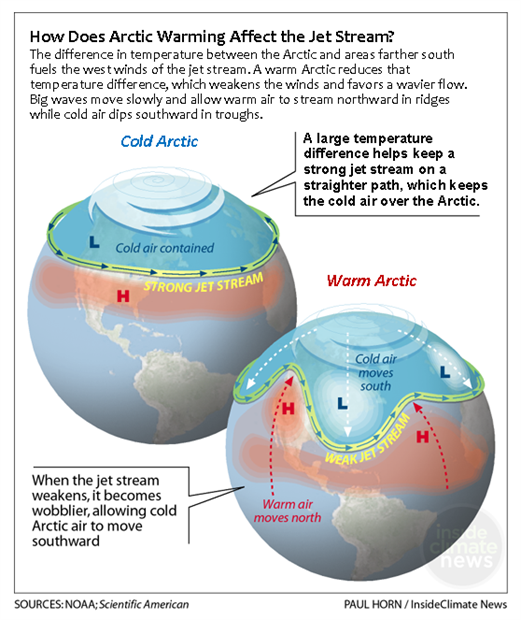
The Arctic is warming two or three times faster than the tropics, due to a melting ice cap and diminishing sea ice, due in turn to general global warming, plus ice-darkening, heat absorbing, soot transported from Canadian and Siberian forests via megafires. Less sea ice and a smaller, darker ice cap create a positive feedback loop that induces more and faster warming. This process is known as Arctic Amplification (AA). Meanwhile, that temperature difference between the Arctic and midlatitude air masses drives the jet stream winds that form at their boundary. Thus, a smaller temperature difference weakens the jet stream, which then meanders more, thus bringing cold air from further north or warm air from further south than it did a few decades ago. (3)
Unlike the Arctic, which only has water beneath its ice, Antarctica is an entire continent covered, on average, by more than a mile-high ice cap, 90 percent of the world’s ice. Thus, it has a much larger heat capacity. It’s also ringed by a continuous cold ocean current that keeps it meteorologically isolated from the rest of the planet. So, there is no Antarctic Amplification comparable to Arctic Amplification, at least not for quite awhile. But check back with us in 200 years.
For a deeper dive, let’s talk about the atmospheric heat engine or how heat moves from the tropics to the poles and how that’s been evolving lately.
Two Main Stages:
Stage 1 — the Hadley Cells
Stage 2 — Midlatitude, Cyclonic Storms
Getting far more sun, the tropics are, of course, much hotter than the poles. And fluids, such as air and water, naturally move heat from hot to cold because temperature differences drive the pressure differences that drive fluids. Tropical air is also pretty humid, due to evaporation from surrounding seas as well as wet vegetation. And hot air can hold a lot more water vapor, an invisible gas, than cold air can. (Air at 104 degrees F. can hold 12 times more water vapor as at 32 degrees F.) (4)
Stage 1 — the Hadley Cells
So, to initiate Stage 1: damp air tends to rise via thermals over tropical hot spots. It then condenses as tiny water droplets, at heights where it’s cold enough to, and turns into cumulus clouds that start to rain out when the droplets get too heavy to stay aloft. The heat released by that condensation adds to the cloud rise, yielding a towering cumulus cloud. But the inversion atop the tropical troposphere keeps air from rising more than about seven miles aloft. Thus, that now quite dry air fans horizontally north and south because its east/west movement is blocked by other tropical cumulus clouds doing the same thing. The net result is that air from the tropics slowly drifts to the subtropics, about 25 degrees latitude, north and south of the equator.
Why there? Because the increasing Coriolis effect turns the flow (more about Coriolis on facing page). Meanwhile, as pressure forces disallow a vacuum, the air completes its circuit by descending to near the surface and flowing back to the tropics. There are two of these circulations, called the northern and southern hemisphere Hadley Cells. Because the dry air heats up during its descent by compression, the subtropics are largely deserts: the Sahara, Arabian, Gobi, Sonoran, Kalahari, Australian, Chihuahuan Great Victoria — inhospitable areas like that, that are also creeping further north and south into places like Arizona due to global warming. (5, 6)
A nice Youtube video by Allison Wing’s team at Florida State University uses ink blobs to display a Hadley circulation, in a water tank that rotates slowly to induce a modest Coriolis effect, while they fill the center with ice water to provide the driving temperature difference. (7)
Stage 2 — Midlatitude, Cyclonic Storms
Starting at the higher latitude edge of the subtropics, these giant storms are chaotic, semi-turbulent eddies, a thousand miles or more across that swirl continuously to move heat from the Hadley Cells all the way to the polar regions.
Why swirl? Because the midlatitudes are far enough from the equator that the Coriolis effect becomes a major driver. As a child, did you and your friend ever ride a merry-go-round, try to toss a ball toward each other and miss very badly? If so, you may have noticed the Coriolis effect. Off the merry-go-round, the ball goes straight, but while astride it, the ball appears to curve sharply away from the direction of rotation. Likewise, on a rotating Earth, the Coriolis effect derives from the straight line momentum of large air masses moving from the subtropics toward lower pressure areas. Yet, as on a merry-go-round, the Earth’s rotation also steers large air masses away from the direction of rotation, deflecting them to the right, i.e., “cyclonically,” when moving North, or to the left, “anti-cyclonically,” when moving South.
The Coriolis effect also gets stronger toward the poles because the distance shortens from the Earth’s surface to the axis of rotation (from pole to pole through the Earth’s center). It’s the same effect as when ice skaters spin faster by folding their arms and legs inward toward the axis of rotation.
In order to complete the transfer of heat from the tropics to the poles, intruding subtropical air from nearer the Earth’s surface pulls down and mixes with polar air from higher up. Meanwhile, the northern edge of that mixing, where winds are fastest, defines the jet stream. So, the jet stream marks the boundary between the midlatitude and polar air masses. (8)
Jet Stream Under Arctic Amplification (AA)
The above-mentioned Professor Wing adds drops of dye to a faster rotating dish pan to show the basic effect. Due to its faster rotation, instead of one long Hadley circulation, several eddies form around the pan. (9)
So, a large temperature difference induces a large pressure difference, which drives the fluid to produce a tight set of regular eddies. As in the Youtube video, there are typically five or 10 such eddies circling from west to east in the midlatitude, northern hemisphere. And because they’re chaotic, semi-turbulent phenomena, these eddies do occasionally split or merge.
Not shown on the Youtube video — but reduce the temperature difference, and the eddies will slow down, and start to meander. That is, like a top or a bicycle, they move smoothly and steadily, as long as they have lots of momentum. But, neither the point on a top nor the surface it spins on are perfectly smooth. For a bicycle, the street isn’t perfectly smooth, neither are the tires nor the cyclist’s pumping motions. The Earth also has mountains, valleys, seas, irregular coastlines, ocean currents, ice caps, clouds, hot and cold spots, small-scale weather, etc. The point is that each of these imperfections introduces instabilities (wobbly meanders) that grow as the momentum starts to wane.
A Few More Nuances
Due to friction from being a fluid, our atmosphere also rotates, on the whole, more slowly than the solid Earth below it. So, since the Earth rotates from west to east, the equatorial (trade) winds move from east to west. However, the Coriolis effect tends to transport cyclonic storms in the opposite direction, i.e., from west to east, at an average speed of about 750 miles per day. This eastward movement is called the “zonal wind” because it crosses the zones of longitude. (10)
As above, as global warming proceeds, hotter air carries more water vapor, which may rain out within the tropics, or gets carried by storms into the midlatitudes or even the Arctic, to appear as torrential rain or even blizzards. Thus, the sum of the Hadley and midlatitude circulations, plus global warming, suggests that wet regions will get wetter, while already dry areas, such as our subtropical deserts, will trend drier. These sometimes counter-intuitive aspects of AA have been borne out by mathematical theory and computer modeling, as well as many observational studies. (11, 12)
Prolonged Cold Snaps
Evidence suggests that when the jet stream meanders more than usual, the above-mentioned zonal wind decreases in the vicinity of the meander, thus prolonging its stay at that location. (13, 14)
Moreover, as part of AA, the uneven melting of sea ice tends to stretch and even split the “polar vortex,” which is a swirl of stratospheric winds surrounding the North Pole that differs from the lower level, tropospheric jet stream that circulates further south. However, a disrupted polar vortex can also augment jet stream meander. Another aspect of AA is decreased sea ice and snow cover, which, along with high terrain, such as over Greenland, can trap a jet stream loop, causing extended cold snaps much further south. (15, 16, 17)
In fact, one recent study showed how AA, in the form of decreased Arctic sea ice, caused the polar vortex to meander far to the south, resulting in the prolonged and damaging Texas cold snap of 2021. (18) There are many such studies. The above is just a small sampling.
So, the next time someone asks how one or even two degrees of global warming can cause a 20-degree heat wave that lasts a week or more, let alone a prolonged cold snap, you can respond with perhaps more than they ever wanted to know.
Endnotes:
1.R. F. Kamada, “Changing Climate: Adaptation or Extinction,” Whatcom Watch, Oct/Nov 2017, https://www.researchgate.net/publication/329862408_Changing_Climate_Adaptation_or_Extinction_Whatcom_Watch_Online
2.U.S. Environmental Protection Agency https://www.epa.gov/climate-indicators/weather-climate
3.S. K. Johnson, Ars Technica, https://arstechnica.com/science/2021/02/blaming-a-wiggly-jet-stream-on-climate-change-not-so-fast/
4.W. H. Brune, “Phase Diagram for Water Vapor: Clausius–Clapeyron Equation,” J. A. Dutton Institute, Penn State University, https://www.e-education.psu.edu/meteo300/node/584
5.https://en.wikipedia.org/wiki/Hadley_cell
6.W. Johnson, “Why Is Phoenix So Hot?,” The Arizona Republic, Feb 9, 2017: https://www.azcentral.com/story/news/local/arizona-weather/2016/06/16/why-is-phoenix-so-hot/85950934/
7.https://www.youtube.com/watch?v=IG6L7twn9MY
8.https://simple.wikipedia.org/wiki/Extratropical_cyclone
9.https://www.youtube.com/watch?v=NRsH-U0AJwU
10.http://www.physicalgeography.net/fundamentals/7s.html
11.W. Moon, B-M Kim, G-H Yang, and J. S. Wettlaufer, Proc. Nat. Acad. Sci., Sept 12, 2022, 119 (38) e2200890119: https://www.pnas.org/doi/full/10.1073/pnas.2200890119, https://doi.org/10.1073/pnas.2200890119 .
“As the high latitudes warm more rapidly under global warming, the reduction in zonal mean wind strength can trigger wavier atmospheric jets.” “As global warming enhances polar amplification, the midlatitude jet stream intensity is suppressed. The confluence of these effects leads to wavier jet streams.”
12.J. Cohen, et al., “Divergent consensuses on Arctic amplification influence on midlatitude severe winter weather,” Nature Climate Change, 10, 20–29, 2020: https://www.nature.com/articles/s41558-019-0662-y?proof=trueIn
“Observational studies overwhelmingly support that AA is contributing to winter continental cooling.”
13.J. A. Francis, N. Skific, S. J. Vavrus, “North American Weather Regimes Are Becoming More Persistent: Is Arctic Amplification a Factor?,” Geophys. Res. Letts, 45, 20, 11,414-11,4222, Oct 28, 2018: https://agupubs.onlinelibrary.wiley.com/doi/full/10.1029/2018GL080252, https://doi.org/10.1029/2018GL080252
“… we also show that there is a direct stationary Rossby wave response to low spring North American snow cover that enforces an anomalous anticyclone over Greenland, thus helping to anchor the ridge over Greenland in this wavier atmospheric state.”
14.I. Preece, J. R., T. L. Mote, J. Cohen, L.J. Wachowicz, J. A. Knox, M. Tedesco, and G. J. Kooperman, “Summer atmospheric circulation over Greenland in response to Arctic amplification and diminished spring snow cover,” Nature Comm., June 23, 2023: https://www.nature.com/articles/s41467-023-39466-6.epdf, https://doi.org/10.1038/s41467-023-39466-6
“We also find that large-scale patterns consistent with a warm Arctic exhibit an increased frequency of long duration events (LDEs), suggesting that further Arctic warming may favor persistent weather patterns that can lead to weather extremes.”
15.M. Mann, S. Rahmstorf, K. Kornhuber, B. A. Steinman, S. K. Miller, and D. Coumou, “Influence of Anthropogenic Climate Change on Planetary Wave Resonance and Extreme Weather Events,” Sci Rep. 2017; 7: 45242. Mar 27, 2017, doi:10.1038/srep45242, PMID: 28345645
16.International Panel on Climate Change: “Special Report on the Ocean and Cryosphere in a Changing Climate,” Chapter 3: Polar Regions, Dec 23, 2019: https://www.ipcc.ch/srocc/download/#pub-spm
17.S. H. Lee, J. C. Furtado, A. J. Charlton-Perez, “Wintertime North American Weather Regimes and the Arctic Stratospheric Polar Vortex,” Geophys. Res. Letts. 46, 24, 14892-14900, Dec 27, 2019: https://agupubs.onlinelibrary.wiley.com/doi/full/10.1029/2019GL085592, https://doi.org/10.1029/2019GL085592
18.Ruonan Zhang, J. A. Screen, and Renhe Zhang, “Arctic and Pacific Ocean Conditions Were Favorable for Cold Extremes over Eurasia and North America during Winter 2020/21,” Bull. Am. Met. Soc., 103, 10, Oct 1, 2022, E2285–E2301, https://journals.ametsoc.org/view/journals/bams/103/10/BAMS-D-21-0264.1.xml
DOI: https://doi.org/10.1175/BAMS-D-21-0264.1
____________________
Ray Kamada, former director of the Environmental Physics Group at the Naval Postgraduate School, Monterey, Calif., is also a member of the Whatcom County Climate Impact Advisory Committee. He has authored about 50 articles on energy conservation, climate change, and renewable energy.