by Preston L. Schiller
Part 4
This is the fourth and final part of a series about how to improve Whatcom Transportation Authority’s (WTA) transit ridership in Bellingham and Whatcom County. Since at least 80 percent of its ridership, and an equivalent percentage of its revenues, are within Bellingham, most of the focus of this series has been about this city. Because transit is a vital social, mobility and environmental service, the whole community benefits directly or indirectly from it.
If you’re primarily a motorist for travel and think that traffic is slower in some corridors than you like, think about how much slower it would be without those thousands of persons riding the bus daily rather than driving in single occupant vehicles (SOVs). Think about your transportation carbon footprint compared to theirs. And think about getting on the bus, Gus (or Gussie), for at least some of your trips.
Parts 1 and 2 mostly discussed some of the issues WTA is contending with, especially its inability to increase ridership in recent years. For comparison, it offered the experience of a similar city’s (Kingston, Ontario, Canada) transit reforms that led to a doubling of ridership within the past decade — a rate of increase virtually unheard of in the transit world. The awkward way in which WTA is governed, a board dominated by interests outside of Bellingham, was also discussed.
Part 3 explored a number of changes WTA could make internally that might lead to attracting more riders. Some involved planning and service provision, some involved policy changes that its board could initiate. But much of what could help to grow transit ridership remains outside the control of WTA. Much of it involves changes that employers, government and citizens need to promote in cooperation with WTA for such growth to occur. The example of the major regional employer and trip generator, PeaceHealth St. Joseph, seriously underperforming in transit, was analyzed in terms of policy and planning change that need to occur there to increase ridership.
Part 4 examines why employer practices and urban/locational planning are so important to sustainable transportation, and explores the prospects for improving these in our region. It looks at specific instances of employers and institutions, such as local governments, who are doing some things right, as well as others who are clearly deficient in this realm. It concludes with a discussion about how citizens, businesses, institutions and policy makers could better work together to grow transit and reduce the environmental and social impacts of automobility.
City of Unsubdued Driving
The underlying transportation fact of life for Bellingham and Whatcom County is over-dependence on the private motor vehicle as the main form of mobility. U.S. Census-derived data for Bellingham for the journey-to-work (JTW), displayed in the accompanying figure “Bellingham Mode Shift Goals” indicate that 75 percent of Bellingham residents commute by motor vehicle, 5 percent take the bus, less than 4 percent cycle, around 5 percent work from home, and a little over 8 percent walk to work. These percentages have remained relatively stable, with some improvement for walking, for many years despite the city’s growing attention to improving bicycle and pedestrian infrastructure. (1)

Source: City of Bellingham, Transportation Report on Annual Mobility, 2017: https://www.cob.org/Documents/pw/transportation/2017_TRAM_ FinalPublish.pdf.
Automobility vs. Transit
The over reliance upon the car for virtually all mobility is also referred to as automobility. It has many adverse consequences including being a major contributor to oil dependence and climate change: 30 to 40 percent of the greenhouse gases (GHGs) total in our part of the planet and 44 percent of Washington’s, according to Gov. Inslee. Transportation is the major source of regional air pollution, an oversized part of a household’s budget, and leads to unhealthy outcomes for drivers and their regular passengers. It is a major source of pollution-related morbidity and mortality and premature death and injury in the U.S.
It is unwise to expect that electric vehicles (EVs) or autonomous vehicles (AVs) will rescue us from these problems any time soon: Electric vehicles may take several decades to dominate the automobile fleet, and even more to replace the highly popular full-sized pickup truck. The EV carbon and pollution footprint depends upon that of the upstream energy source. Because of its improved acceleration, the EV might add to car-related crash deaths and injuries. The much-hyped autonomous vehicle may lead to nightmare scenarios not being realistically appraised by its current promoters: more vehicle miles traveled, more sprawl, less walking, cycling or transit availability and use. (2)
Automobility Costs vs. Transit
Transit suffers when automobility is ensconced in the daily lives of residents, in public policy at all levels of government, in government budgets, in private sector practices, and in land use and transportation planning. When cars are first, and allowed to devour as much street space and off-street space for parking, then transit (along with walking and cycling) is served the leftovers; it is more of an afterthought than a priority. While there is much lip service being paid to making walking, cycling and transit priorities in government, relatively little of that is translating into spending sufficiently enough to realize that goal or needed adaptations of infrastructure.
It is exceedingly difficult to tease some spending details out of Bellingham and Whatcom County budget reporting, but it appears that walking, cycling and transit are allotted insufficient amounts in comparison to feeding the needs of motor vehicles. If government is to take seriously the goals it has set for each of these modes, it will have to spend much more than at present — and spend less on automobility. Government should be allocating funds based on future mode-share targets, as well as making reparations, in the form of infrastructure and operating needs, for historic neglect of the sustainable transportation modes.
Major Employers and Transit
Most employers in Bellingham could benefit from encouraging at least some of their employees to commute by bus or WTA vanpool. Bus passes would not be very expensive to subsidize, employers would have far fewer parking worries and costs, and the employees would save a considerable amount of car expense, as well as gain some health benefits. Employers could also point to their support of transit as part of their commitment to reducing carbon footprints.
Location, Location, Location!
The easy accessibility of quality transit appears to be one of the least concerns of most Bellingham employers when they make a locational decision. Many employers have been located on or near good transit services more by historical accident than by design. In the research I undertook in the 1990s for the early planning of the express routes connecting Bellingham, Mount Vernon and Everett (now the 80X and 90X routes), it was determined that most of the major regional employers were located within the city limits of those cities, and most were on existing transit lines.
It was also found that a sizable number of college students were commuting in either direction between Bellingham and Mount Vernon. It was on the basis of these and other research findings that early planning moved forward and led to their considerable success. (3) Having transit accessible to a worksite or potential site is not sufficient for its use by employees; there needs to be active promotion and subsidization of transit in order for that to occur.
Passing Up Passes
Promoting and subsidizing employee transit passes is one of the easiest and least expensive ways for employers to promote bus commuting. Despite considerable effort, WTA has not been able to convince more than a handful of Bellingham employers to undertake a bus pass program. There are at least 40 Whatcom County employers with 200 or more employees. (4) Most of these are located within the city limits of Bellingham. Some of these, such as banks, large medical groups and the school district, have some dispersed worksites, but still have a central administrative location that is well-served by transit. Others could probably gain WTA’s cooperation in service improvements were they to create greater demand for such.
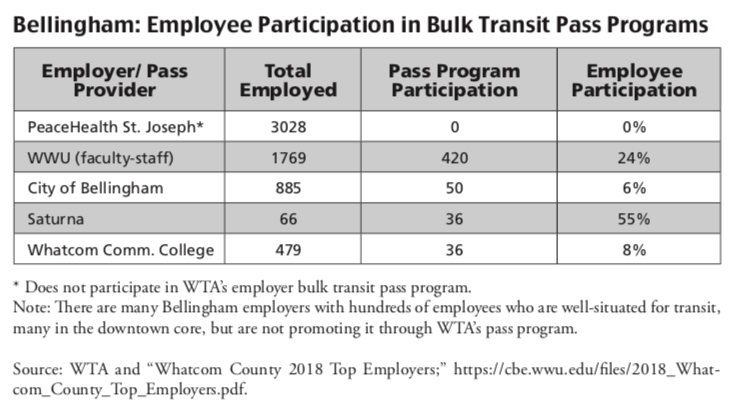
The highest rates of employee bus pass holders are at WWU, City of Bellingham (COB) and Saturna, a relatively small investment firm located in the center of downtown, a block from the transit center (see accompanying table, Bellingham: Employee Participation in Bulk Transit Pass Programs). Transit passes are good for the transit agency; they allow quicker boarding and better ways of tracking and analyzing ridership. Seventy-five percent of WTA’s riders, especially WWU and WCC students, use passes and only 14 percent pay with cash. (5)
WWU: Hub or Pass-Through?
Western Washington University (WWU) has approximately 1,800 full-time and half-time employees in addition to a large number of student part-time employees. It does a fair amount to encourage students, faculty and staff to use sustainable modes of transportation. It has two full-time sustainable transportation administrative staff who oversee their government-mandated Commute Trip Reduction efforts, the transit pass programs, late night shuttles that are WWU owned, but operated by Bellair Shuttles, and respond to inquiries. (6) WWU has found WTA to be very responsive and supportive of its needs.
As previously noted, WWU students voted several years ago to impose a quarterly transit pass fee upon themselves, which led to a significant increase in WTA ridership. WWU also limits and prices parking available for students and faculty and staff. Many of the lots, especially those closest to campus, have waiting lists for parking permits. WWU pays WTA a bulk rate of $45.50 per month for each employee pass, and then subsidizes half that amount for each pass an employee purchases. Approximately 25 percent of those eligible for the passes subscribe to the program.
In the early 2000s, there was discussion in planning exercises at WWU about having a campus transit hub; a place with ample room for buses to turn around, as well as a secure comfortable area for passengers to wait. At present, there is not a good place for buses to turn around on campus, so they simply pass through and turn around elsewhere. Such a hub might have made it easy for WTA to elongate certain routes, such as those connecting downtown with Cordata, or shorten certain routes, such as those serving Fairhaven or other neighborhoods, because they could now easily connect with routes heading to and through downtown. Perhaps it is time to revive this discussion?
City of Autoham
The City of Bellingham (COB) has done much to try to promote sustainable transportation (ST) and transit in recent years. It has formulated a number of policies, including making walking and cycling its priorities as well as being verbally very supportive of transit. But policy does not always go beyond talk to changing the mechanics of how the city operates or whether such priorities translate into its budget. As discussed above, it does not appear the city is actually funding sustainable transportation at the levels it needs or deserves. Since there is much synergy between the green modes of walking, cycling and transit in reducing automobility, the city should assist this through changing budgetary priorities to align with policy priorities. It is time for the city to put its money where its modal mouth is.
Sprawlingham?
One of the most important factors shaping whether a community is transit amenable or not is its residential and commercial densities and the ways that a transit service takes advantage of these. Of these two density factors, data for residential densities are easier to obtain than for commercial — which is generally measured in terms of employment, and somewhat for retail activities. A rough rule of thumb in transit planning considers a residential density of at least seven residential units per acre to be the threshold for minimal transit service. At present the city of Bellingham, at 6.5 overall, does not meet that threshold. The cities of Ferndale and Lynden each have residential densities about half of Bellingham’s, and it is possible that there are no neighborhoods in those cities that rise to at least seven residential units per acre. Worse yet, all three cities are developing in ways that either diminish density or cluster development in areas that are not amenable to walking, cycling or transit use.
The efforts that Bellingham is making to foster conveniently located urban villages are more than offset by the low-density sprawl creeping into its hills and outskirts. Recent examples of such poor planning include the King Mountain developments and the incorporation of a very low-density area questionably designated as an urban growth area. The smart thinking in urban planning, over many decades, finds that low-density development is a bad deal because it requires much higher subsidies for services, such as roads, utilities, emergency and public safety, than does compact development. Better planned cities, such as Kirkland (Wash.), a “star” in growth management, wisely wait until a low-density area has attained a level of density (residential and commercial) to make it an attractive addition rather than a drain on its coffers.
![]()
Victoria’s Transit Secrets (7)
The difference that density and sprawl versus compact development can make in transit ridership is dramatically demonstrated in the table: Victoria (British Columbia) vs. Bellingham, as well as when neighborhoods within Bellingham, are compared in the table: Residential Density and Transit. While each city has a a similar-sized population and each is embedded in a large metro area, the city of Victoria at 7.5 square miles is much more compact than Bellingham at 30 square miles. Population density for Victoria is 11,412 residents per square mile, while Bellingham’s is 3,216. Total transit ridership, regular routes and special services for Victoria is 27 million and rapidly growing (see figure “Victoria Transit Ridership Growth”) — WTA’s is 4.8 million and stagnant or slowly declining. Unsurprisingly, the regional transit system for Victoria is widely considered to be one of the finest across Canada. (8)
The policy climate within which a transit system operates can also influence significantly its financial situation: In British Columbia, the Provincial government pays for 63 percent of Victoria’s paratransit service and 32 percent of its regular bus services. (9) WTA gets relatively little for either of these from the state of Washington, especially in the era of Tim Eyman, citizenry tax avoidance and transit-uninterested public officials.
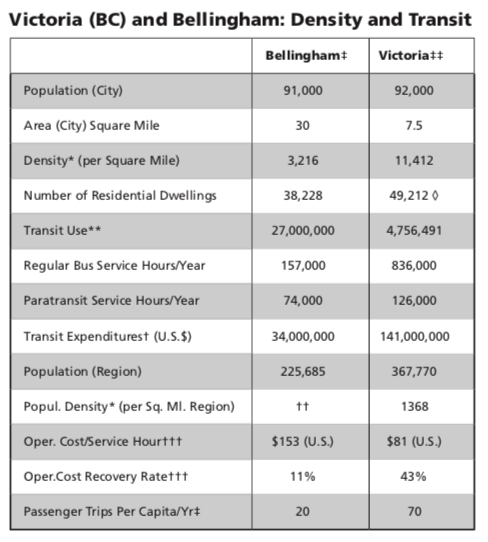
‡ Includes whole WTA service area for some entries
‡‡ Includes Greater Victoria Region for some entries
* Residential: Residences per developed acre
** Total Annual trips by agency, includes paratransit; most WTA ridership is in Bellingham, most Victoria region’s ridership in the the City of Victoria, although there are more regional riders there than WTA’s. Paratransit trips account for only a small percent of the ridership for each.
*** Estimated for 2019
† Total operations budget, regular bus + paratransit services costs
†† Probably around 500 or 600/sq.mi. or 1/3 of Greater Victoria’s area: Whatcom’s density is difficult to estimate due to larger amounts of public land/forestry but is probably around 200-300 persons/sq.mi. outside of Bellingham.
††† Regular bus service
◊ About 8% (3,500) of these are unoccupied: Victoria has a higher rate of unoccupied dwellings, compared to Bellingham, probably due to tourism and seasonal use.
Sources:
www.bctransit.com/about/facts/victoria; National Transit Database (2017, U.S.);
WTA Transit Development Plan 2019-2024;
WTA 2018Annual Performance Report;
WTA 2018 Report & Transit Development Plan (for) 2019-2024.
____________________________
Victoria’s Lessons
While Bellingham cannot incredibly (or credibly) shrink itself, there are several lessons that can be derived from Victoria and its numerous transportation and transit publications (10). Here are but a few:
• If you want better transit ridership, you need to spend more and provide more service in the city.
• You need to increase your density and not incorporate low-density areas inimicable to transit.
• You need to introduce a number of efficiency measures to keep your hourly bus costs down.
• You need to coordinate your land use and growth planning with that of WTA, especially in the planning of densification and infill, transit priority built into routes, and making the streets for most routes more pedestrian- and transit-friendly.
Revert One-Way Streets?
Changing two-way streets in commercial centers to one-way streets, as has been done widely in previous decades in order to accommodate more traffic, has been shown to be harmful to safety, commerce and transit. Some of these were done at the behest of asphalt-stuck state transportation departments, some at the behest of local traffic boosters. Many cities far and near are reconsidering such arrangements, and many successful efforts to revert wide one-way streets to two-way, especially in downtowns, have been successful at improving safety and commercial activity. (11) One-way grid systems coupled with long blocks are generally viewed as harmful to transit; transit planners generally prefer to place bus stops on opposite sides of two-way streets, and retailers benefit from shorter blocks with more intersections.
Midblock Crossings?
An issue with which the city of Bellingham should engage is the problem of the very long one-way blocks downtown, which were transformed into a one-way grid system several decades ago in order to accommodate a small amount of congestion at the Georgia-Pacific (G-P) pulp mill shift changes. Historically, the long north-south blocks served the purpose of trains stopping downtown without interfering with east-west streets. The railroads stopped running through downtown a hundred years ago or more, but the problem of long blocks remain. Such blocks force pedestrians to cross streets only at widely spaced intersections. They also reduce the number of prime retail frontage corners. The city can begin to remedy this quickly by instituting well-marked and, possibly, signalized midblock crossings, in order to help pedestrians and local commerce. (12) Where possible, the city could begin to create midblock walkways, perhaps using existing parking lots and other downtown vacant or “dead spaces,” connecting the long north-south blocks as further pedestrian and commercial enhancements.
Set a Good Example
Government, at all levels, needs to become an example of sustainable thought and activity — especially in the realm of transportation, which is responsible for almost half of our greenhouse gas emissions. (13) While the city of Bellingham (COB) is doing considerably better than its counterpart across the street at the Whatcom County Courthouse, it could do more, much more:
• It has only enrolled 50 among its 885 employees in its transit pass program — despite the fact that most COB employees are based at or near City Hall. It needs to find ways to make driving to work less cheap and taking the bus more attractive. It is smartly looking at e-bikes and cargo bikes for some short trips and deliveries during the workday; could it look at transit for such purposes as well?
• In 1993, I played a role in the passage of a state law that mandated that motorists must yield to buses trying to re-enter traffic after a passenger stop. (14) That is the source of the triangular sign on the back of buses reminding drivers to yield. It does not seem to be enforced. One small and easy way COB could help WTA is to educate Bellingham motorists about this need, and to enforce it. The bus stalled at a stop while many motorists refuse to let it re-enter traffic costs WTA a great deal of time in the aggregate, and inconveniences passengers as well.
• It needs to make transportation a multidepartmental integrated concern, especially involving planning and parks and recreation, not just insulated in the public works department. The example of GO Boulder’s integrated planning unit as well as the sweeping reform and reorganization of Kingston’s (Ontario) transportation planning and public works chain-of-command are worthy of consideration.
• The City of Bellingham, administration and elected officials, needs to become more involved with WTA. Because transit is such an important part of urban services, development, and environment, it cannot sit on a back burner to be addressed only in one short monthly meeting lacking effective public input and involvement. The current COB minority representation on the WTA board, the mayor and two councilmembers, needs to be expanded to become a majority — perhaps with the help of the newly elected County Executive and the County Council WTA representative; together, these constitute a majority. There is no reason in the law guiding WTA that its board could not be refigured (15), and there is a fair amount of variety in transit board composition around the state. The COB Planning and Transportation Commissions also need to be more directly involved with WTA.
• The City of Bellingham needs to play a greater role in shaping what WTA does for the city. This is especially relevant this year as Bellingham’s Transportation Benefit District, which divides equally several millions of dollars each year between arterial repaving, transit amenities, and walking-cycling improvements, is up for a vote in November.
• As a last resort, COB could do a Boulder Community Transit Network (CTN) gambit; work with the regional transit provider to implement several routes in the city that might provide better and more meaningful service to its riders. (16)
Neighborhoods and Density
An old joke in planning circles has two neighbors conversing: one says, “Isn’t sprawl terrible?” The other replies, “Yeah, the only thing worse than sprawl … is density.” This is not an unfair depiction of the attitudes of many low-density neighborhood urban dwellers who resist any and all forms of densification — as Bellingham’s difficult path to accessory dwelling units (ADUs) has demonstrated.
Is it possible that such neighbors are caught in a vicious cycle of low density leading to less transit, walking, cycling or basics nearby — such as groceries or other amenities, leading to more driving leading to more traffic leading to more desire to sustain low density? Is density in many cities and suburbs experienced mostly through the lens of traffic density? There are several good examples in North America, and many in Europe, of densification done well without major traffic increases. Bellingham has wisely invested in abundant open space, parks and trails, which can offset any issues with densification if it is willing to dampen its overdependence on traffic-generating cars.
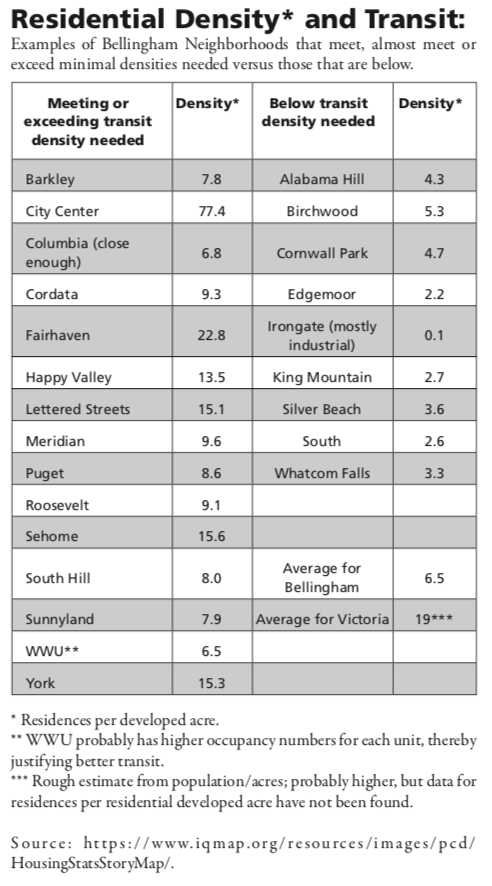 The table “Residential Density and Transit” indicates that while the overall residential density of Bellingham is slightly below what is considered to be the minimal threshold for basic transit service, there is great variability in density from neighborhood to neighborhood. Moderate- to high-density neighborhoods include City Center, Fairhaven, Happy Valley, Lettered Streets and York. Several other neighborhoods have densities appropriate for basic transit services.
Low-density neighborhoods include Edgemoor, South, King Mountain, Whatcom Falls, and others that drag down the citywide average density and possibilities for good transit services throughout the city. Unless Bellingham ceases its expansion into extremely low-density neighborhoods, achieves moderate levels of densification and meaningful mixed use — so grocery stores and basic services and amenities are available within walking distance of most residences — the prospects for transportation sustainability and good transit throughout the city are rather bleak.
What Could Whatcom Do?
While Whatcom County has been doing better in growth management and acquisition of open space in recent years, it still welcomes low-density traffic-generating development in several ways. Especially irksome for Bellingham’s planning is the reluctance of the county to charge new low-density development sufficiently for its impacts. It would also help the cause of sustainable transportation to better protect farmlands and open space from more sprawl development encroachments. Its executive and council representative to the WTA board could recognize that Bellingham is a major part of the county and team up with Bellingham’s mayor and council representatives to begin the reform of WTA, so that it directs transit improvements to those areas where it is most likely to succeed.
State of Washington
At the state level, there has been some improvement in non-highway funding, and more attention paid to non-motorized transportation in recent years. But, the state is still a long ways from sufficiently addressing the needs of transit, walking and cycling in its expenditures or making these a budgetary priority. The successful 2000 Eyman Initiative 695, which then-Governor Locke rushed to solidify in law before the State Supreme Court overturned it, wiped out a good deal of state-level funding for transit. Most transit agencies, including WTA, then had to turn completely to local tax levies for support. Most of these have involved portions of the sales tax, and some have involved local option amounts added onto the motor vehicle registration fees (car license tabs).
At present, WTA is almost completely fiscally dependent upon its sales tax levies for funds other than those generated by its riders’ fares and passes. Other sources of transit funding are few and often politically difficult to pass at the local level. Our state-level officials should explore what adjustments could be made to local tax options, as well as whether additional options are needed.
Federal Government
The ISTEA (17) reforms of the 1990s, which began to move transportation in a more sustainable direction, have been weakened and undercut by recent administrations, Republicans and Democrats alike. It is difficult to imagine much good news or actions regarding public transportation emanating from Mar-a-Lago or Secretary Chao’s Department of Transportation. But, there are a few things that don’t necessarily entail controversial legislation which our senators and congressional delegation might try to do:
• Help transit agencies gain access to federal funds that predominantly go to private and welfare agency special transportation providers for persons needing access to medical facilities.
• Make it easier for transit agencies to receive operations assistance funding. The present rules and regulations make it very onerous for such agencies to receive such funding and so most avoid even trying.
• Our federal representatives, if not doing so already, should make a concerted effort to hold on to what we’ve got in the way of support for public transportation.
Businesses in Bellingham
There is much that businesses, large and small, can do in Bellingham to promote and strengthen transit. As previously noted, the largest employer transit pass supporters are Western Washington University, City of Bellingham, and Saturna. Saturna? This relatively small employer of 66 persons is well located one block from the downtown transit center. But how did this business achieve a rate of over 50 percent employee participation in its transit pass program? Its location is helpful, but its environmental policies help. These include supporting the Whatcom Smart Trips program and not having parking immediately on-site but at a distance almost as far as the downtown transit center.
When one reviews the list of the 40 largest employers in Bellingham and Whatcom County (18), one finds that there are many large Bellingham employers, sometimes with hundreds of employees, that are located in the downtown core or at locations well-served by transit. Clearly, more employers, especially those well located to benefit from transit, need to promote transit passes for their employees.
 More Bus(iness) Passes and Perks
One of the best ways that businesses can improve transit is to promote employee transit passes. If the employer provides free parking, it would be wise to initiate fees for parking and direct some of the proceeds toward bus pass subsidy. While WTA’s support of the Whatcom Smart Trips program is laudable, it might also help promote pass purchases by allowing pass-holders to get discounts at various places, especially restaurants and cafes, by simply showing their pass rather than having to go through registering with Smart Trips. Such a program, “PassPERKS” exists at Kingston Transit and has been very popular with pass holders. (19) Boost The Bus While many businesses are talking “green,” especially around some of their practices, few are effectively promoting green transportation. In addition to promoting bus passes, and informing employees of WTA’s emergency ride home program, businesses could be boosting transit and transit passes through their local Chamber of Commerce or ones that specialize in promoting business interests. It would be especially helpful if businesses involved with development — commercial or residential — began to promote locational choices based, at least in part, around access to transit.
Conclusion: Citizenry
What role the citizenry plays in improving transit is, well, up to the citizenry. Unfortunately, at present, public transportation — however important it is as a mobility, social equity or environmental issue — does not seem to be high on the agenda of social or environmental concerns for most Bellingham and Whatcom County residents or public officials. An activated and better informed citizenry could make a huge difference if they would get involved with transit issues, ride the bus more frequently, buy passes and heed the “Talking Transit Blues” (see upper left gray box).
Okay, Bellingham and surrounds, time to walk or roll down the street and catch the bus.
Talking Transit Blues
With apologies to Pete Seeger, et al: “The Talking Union Blues” (20)
If you want better transit let me tell you what to do:
You got to talk to the folks on the bus with you,
You got to talk to your neighbors down the street,
Talk to the businesses where you work, shop and eat,
Speak up to politicians at the city or the county,
Get their attention, you’ll soon reap the bounty,
More frequent buses, more places to go,
Even more shelters from the rain and the snow ….
(Insert your verses here)
Endnotes
1. Climate Action Task Force Final Report, p. 56 (Dec. 2019): I combine the carpool/taxi share with drive-alone (SOV) since the U.S. is one of the only countries that considers two friends or relatives (sometimes called ‘fampool’) sharing a ride to be worthy of attention; it’s the vehicle that pollutes and two-person carpools generally pull people away from transit.
2. Preston L. Schiller (2016) “Automated and Connected Vehicles: High Tech Hope or Hype?” World Transport Policy and Practice, Vol. 22.3, Oct. 2016, pp. 28-44.
3. P.L. Schiller (2005) “North Sound Connecting Communities Project, Intercounty Transit Committee, Final Report and Recommendations,” (53 pp.), https://www.discovery.org/scripts/viewDB/filesDB-download.php?id=324.
4. Center of Economic and Business Research, WWU, “Whatcom County 2018 Top Employers.”
5. WTA 2018 Annual Performance Report, p. 13.
6. https://sustain.wwu.edu/sustainable-transportation/
7. The author wishes to thank Therese Kelliher of Walk-Bike-Bus Bellingham for pointing out Victoria’s compact nature compared to that of Bellingham.
8. https://www.timescolonist.com/news/local/report-ranks-local-transit-best-for-its-size-1.6060.
9. Victoria Regional Transit System Overview, presentation April 22, 2015.
10. As a start, see sources in Table: Victoria (British Columbia) vs. Bellingham: Density and Transit.
11. One example is Spokane: https://www.inlander.com/Bloglander/archives/2013/06/26/how-downtown-got-so-many-one-way-streets.
There are many more, including: https://www.cnu.org/publicsquare/2019/07/09/cities-benefit-one-way-two-way-conversions.
12. Kirkland’s Lake St. in its downtown core still has a few marked midblock crossings; it used to have many more.
13. https://www.bellinghamherald.com/news/state/washington/article239547368.html.
14. RCW 46.61.220 — https://app.leg.wa.gov/RCW/default.aspx?cite=46.61.220.
15. RCW 36.57A — https://app.leg.wa.gov/RCW/default.aspx?cite=36.57A.
16. https://bouldercolorado.gov/goboulder/bus.
17. Intermodal Surface Transportation Efficiency Act (1991).
18. See note 4.
19. https://www.cityofkingston.ca/residents/transit/fares/passperks.
20. https://www.youtube.com/watch?v=xpWGixCO_9M.
______________________________
Preston L. Schiller is the author of “An Introduction to Sustainable Transportation: Policy, Planning and Implementation, 2nd ed. revised,” 2017. In the 2000s, he led an ex-change between Bellingham and Boulder (CO). He teaches in the University of Washing-ton’s Sustainable Transportation Master’s program and has taught at WWU’s Huxley College and Queen’s University (Kingston, ON). He led the preliminary research and planning that created the express bus routes connecting Bellingham, Mount Vernon and Everett. He has served on many government advisory committees, and chaired the 1990s Policy Committee of the Governor’s Commute Trip Reduction Task Force.