by April Markiewicz

Lake Whatcom, our community’s primary drinking water source, is already showing the effects of climate change as evidenced by increasingly common summer temperature extremes. The most recent occurrence was in 2015, followed by warmer than usual, but less extreme temperatures in 2016. The effects on Lake Whatcom were clearly reflected in several of the water quality parameters for those two years. Data in both the 2015 and 2016 Lake Whatcom Monitoring reports as “atypical” and “unlike any results measured in the last 30 years.”
By 2017, however, weather conditions were more typical for our region with cooler spring and early summer temperatures that helped in moderating chemical and biological processes in the lake to be within more “normal” ranges. In the most recent Lake Whatcom Monitoring Report, the 2017 water quality data reflect those conditions and were within historical ranges, indicating the ecological resilience of the lake to withstand higher summer temperature extremes, at least for now.
It is interesting to note that in the 2016/2017 Lake Whatcom report, certain water quality data for 2015 and 2016 monitoring periods were excluded. According to the report, water temperature and dissolved oxygen profile data for each of the three basins in the lake were excluded in the 2017 data comparisons “because of atypical” patterns” caused by the extreme summer temperatures during those years. One look at the 2015 temperature and dissolved oxygen data compared to the 2017 data (see Figures 1a and 1b), shows just how atypical they were.
July 2015 Dissolved Oxygen vs. Temperature
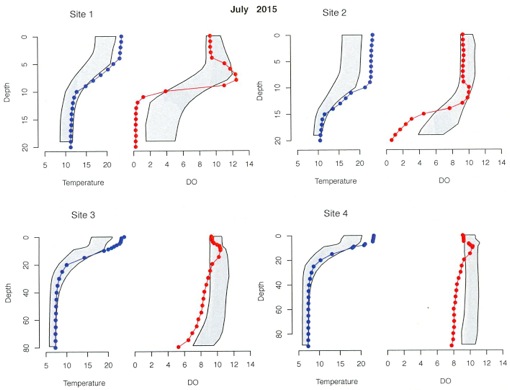
Figure 1a. July 2015 temperature (on left) and dissolved oxygen (on right) profiles with depth compared to 1988 through 2014 minimum/maximum ranges (shaded areas).
July 2017 Dissolved Oxygen vs. Temperature
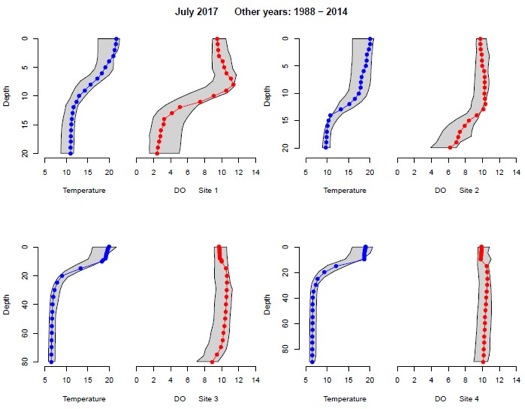
Figure 1b. July 2017 temperature (on left) and dissolved oxygen (on right) profiles with depth compared to 1988 through 2014 minimum/maximum ranges (shaded areas). (The 2015 and 2016 data were excluded from the historic ranges because of atypical patterns.)
Dissolved Oxygen 1988 through 2017
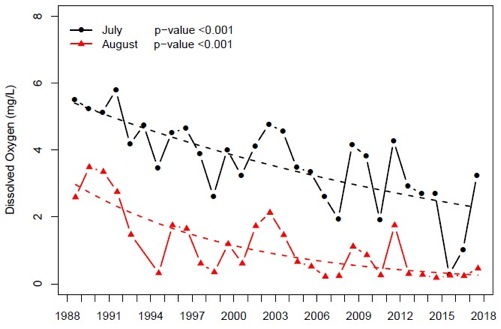
Figure 2. Trends in dissolved oxygen over time in Basin 1 at 14 meters (~46 feet) sampled in July and August from 1988 through 2017 (Matthews et al., 2018).
Climate Change Impacts
As temperature extremes become more common under current and projected changes in our region’s climate conditions, atypical water quality data may need to be incorporated into the historical ranges as the new normal for Lake Whatcom. As illustrated by the 2015 water quality data, higher temperatures set up conditions in the lake that accelerate and enhance biological and chemical processes. The result is higher highs and lower lows for several key water quality parameters. Higher temperature can also adversely affect the survival of cold-water-adapted species and promote growth in warm-water species that can result in changes in aquatic populations, community structures and relationships and ecosystem functions.
Climate change has already altered precipitation and temperature patterns in our region, affecting the snowpack on Mt. Baker, accelerating the melting of its glaciers, and reducing streamflows and groundwater recharge in our county’s river drainage systems and watersheds. The Lake Whatcom water quality data provide compelling evidence of how just two consecutive years of elevated temperatures can dramatically accelerate biological productivity and water quality degradation. Climate change models for our area show that as these extremes become more prevalent, the deleterious impacts to our drinking water source will become more common.
Addressing the causes of climate change and slowing its progression is a global challenge that will take decades, if not centuries. All the more reason to continue our community’s current efforts to mitigate the impacts to the lake from human sources and activities within the Lake Whatcom watershed. The Lake Whatcom Management Committee has taken a leadership role in enacting new rules and regulations for the protection of the lake and its surrounding watershed, having stormwater runoff treatment facilities installed in the watershed, and implementing the property acquisition program, as well as the homeowner incentive program, to name a few.
Their actions have resulted in more restrictive land clearing and development standards in the watershed, zoning changes and incentives to reduce building density and bans on phosphorus-containing fertilizers and the operation of two-cycle engine watercraft on the lake. Successes include newly installed and retrofitted stormwater treatment systems that are now removing more phosphorus, contaminants and particles from entering the lake than ever before; 1,787 acres of undeveloped land in the watershed of land have been acquired through the Lake Whatcom Reservoir Property Acquisition Program; and the Homeowner Incentive Program has been expanded and improved as of 2017 (COB, 2018a). Last, but not least, approximately 8,800 acres of forested lands in the watershed formerly managed by the Washington Department of Natural Resources have been conveyed back to Whatcom County to be managed as low-impact park lands.
These efforts have helped to slow down the rate of water quality degradation in Lake Whatcom and, in turn, helped to reduce the long-term impacts from these latest temperature extremes. One only has to look at the historical water quality data (see Figures 1-6) to see that the slope of the data from 2005 — present is less steep than the slope of the data from 1995 — 2004. The 2018 report goes further to state that though the annual data for chlorophyll and blue-green bacteria (Cyanobacteria) are variable, they appear to have stabilized since 2004.
Green Algae (Chlorophyta) 1994-2017
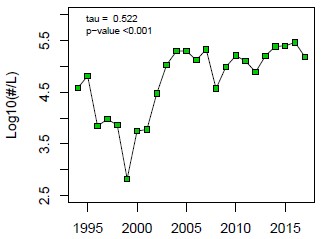
Figure 5. Median summer near-surface green algae (Chlorophyta) counts from June through October all sites and depths (1994 – 2017 (Matthews et al., 2018).
Other water quality data, however, indicate that the degradation is continuing. Phosphorus and nitrogen are the key nutrients that influence the type and abundance of microorganisms in the lake. Algae use dissolved phosphorus and inorganic nitrogen (DIN) (i.e., nitrate (NO3-) and ammonium (NH4+)) for growth. Therefore, the lower these concentrations are in the oxygenated water column, the more algae there must be consuming them, which is indicative of the level of biological productivity in the lake. Phosphorus concentrations were at or below analytical detection limits (see Figure 3) and nitrogen (DIN) concentrations continue to decline each year (see Figure 4).
Total Phosphorus 1994 Through 2017
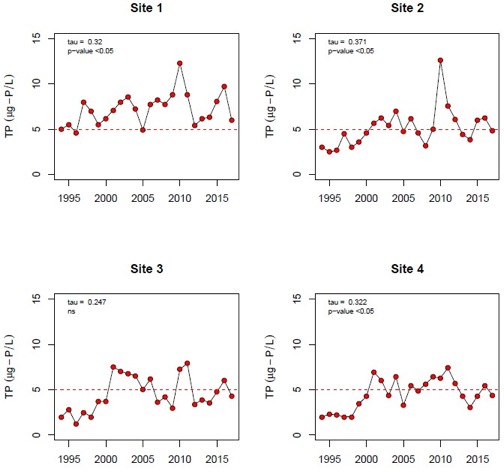
Figure 3. Median summer near-surface total phosphorus concentrations over time at each sampling site from 1994 – 2017 (Matthews et al., 2018).
Dissolved Inorganic Nitrogen 1994 through 2017
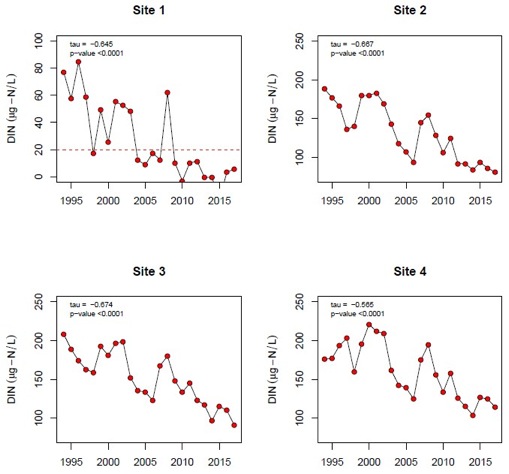
Figure 4. Minimum summer near-surface dissolved inorganic nitrogen (DIN) concentrations over time at each sampling site from 1994 – 2017 (Matthews et al., 2018).
Conversely, phosphorus and ammonium concentrations in the unoxygenated lower water column layers during the summer months continue to increase. An in-depth description of nitrogen and phosphorus cycling in Lake Whatcom can be found in the Matthews et.al., 2018 report.
Lake Whatcom 2017 Conditions
The cooler temperatures in the spring and early summer months of 2017 delayed the thermal stratification of the three basins until June. This delay shortened the overall time that the colder, denser water in the deeper layers was isolated from the oxygenated warmer, less dense upper layer. As a result, dissolved oxygen therefore persisted longer in the deeper waters of each basin over the summer months before biological processes in the lower layers consumed it, creating unoxygenated water in Basins 1 by August and low dissolved oxygen levels in Basin 2. Oxygen deficits measured in Basin attributed to warmer late summer temperatures decreased the ability of oxygen to remain dissolved in water, the report stated. Dissolution of metals, phosphate, sulfate and other contaminants from the sediments that occurs under the anoxic conditions were less severe, resulting in lower concentrations of them in the overlaying waters.
Key Points from the Report:
• The rate of dissolved oxygen loss from the bottom waters of Basins 1, 2 and 3 by July was within historical ranges (see Figure 1b) compared to 2015 data (see Figure 1a).
• Dissolved oxygen concentrations at 14 meters deep in Basin 1 in July were higher due to the cooler spring and early summer temperatures that delayed the onset of oxygen depletion from biological processes (see Figure 2).
• Total phosphorus (TP) levels decreased in all basins to be at detection limit in Basin 1 and below detection limit in Basins 2-4 (see Figure 3).
• Dissolved inorganic nitrogen, an indirect, but sensitive indicator of algal productivity decreased in all three basins (see Figure 4).
• Green algae (Chlorophyta) counts decreased slightly; however numbers in general are continuing to increase (see Figure 5)
• Chlorophyll (Chl) concentrations decreased slightly in all three basins; however the amount in algal cells is influenced by age and condition of the cell, resulting in variable concentrations. Matthews et al. (2018) states these concentrations have stabilized since 2004.
• Bluegreen bacteria (Cyanobacteria) populations remain relatively constant in all three basins. Matthews et al. (2018) states these populations have stabilized since 2004.
• Total trihalomethanes, which are known carcinogens created during the disinfection process of water treatment, continue to decrease during the peak summer months from July through September. In 2017, they decreased in tap water to about 0.035 mg/L, down from the high of 0.06 mg/L in 2015 and 0.04 mg/L in 2016 (see Figure 6).
The maximum allowable contaminant level is 0.08 mg/L. (Note: The number of sites used to calculate the quarterly averages increased from four to eight in 2012 (vertical dotted line).
Total Trihalomethane 1991 through 2017

Figure 6. July through September total trihalomethane (TTHM) concentrations in the city of Bellingham’s water distribution system from 1991 – 2017 (Matthews et al., 2018).
Impaired Lake Water, but Clean Drinking Water?
The latest data show that the biological activity in the lake is continuing to gradually increase and that water quality is continuing to be slowly degraded throughout the entire lake. Current climate change conditions are creating new challenges in our community’s efforts to clean up the lake as required by state and federal laws.
In the meantime, the city of Bellingham is in the process of building a new water pretreatment system that should be online by this fall (COB, 2018b). Once constructed, the dissolved air floatation (DAF) system will remove filter-clogging particles from the raw lake water before it is processed at the existing water treatment plant. The DAF system disperses microscopic air bubbles through the water to which oils or other organic matter become attached and float to the surface where they can be easily skimmed off.
Reducing the particles in the water will reduce or eliminate filters from being clogged and will also reduce the creation of trihalomethanes. As a further precaution against the formation of trihalomethanes, the city is also upgrading the water treatment process by replacing the use of chlorine gas with hypochlorite and adding a powdered activated charcoal to the treatment process to address taste and odor concerns (COB, 2018b).
More treatment comes at a cost. The project is estimated to cost taxpayers about $11.4 million. Moreover, the more steps there are in the treatment process, the more likely one or more may become compromised or fail. Maintenance will be the key to ensuring that we maintain high quality drinking water for us and future generations as climate conditions continue to change and present more challenges to our community.
References
• COB [City of Bellingham]. 2018a. Lake Whatcom Reservoir Programs and Projects. Accessed 04/26/2018 at https://www.cob.org/services/environment/lake-whatcom/pages/programs-projects.aspx.
• COB [City of Bellingham]. 2018b. Water Treatment Plant Pretreatment, Project Overview: EW-0180. Accessed 04/26/2018 at https://www.cob.org/gov/projects/Pages/Public%20Works/pretreatment-ew-180.aspx.
• Matthews, R.A., M. Hilles, J. Vandersypen, R.J. Mitchell, and G.B. Matthews. 2016. “Lake Whatcom Monitoring Project 2014/2015 Report.” Prepared for the city of Bellingham, Bellingham, Washington. February 23, 2016. 267 pages. Available online at https://cedar.wwu.edu/lakewhat_annualreps/24.
• Matthews, R.A., M. Hilles, J. Vandersypen, R.J. Mitchell, and G.B. Matthews. 2017. “Lake Whatcom Monitoring Projct 2015/2016 Report.” Prepared for the city of Bellingham, Bellingham, Washington. February 21, 2017. 376 pages. Available online at https://cedar.wwu.edu/lakewhat_annualreps/25.
• Matthews, R.A., M. Hilles, J. Vandersypen, R.J. Mitchell, and G.B. Matthews. 2018. “Lake Whatcom Monitoring Project 2016/2017 Report.” Prepared for the city of Bellingham, Bellingham, Washington. February 23, 2018. 375 pages. Available online at https://cedar.wwu.edu/lakewhat_annualreps/26.
__________________________________________
April Markiewicz is a toxicologist and the associate director at the Institute of Environmental Toxicology at Huxley College of the Environment at Western Washington University, as well as president of the People for Lake Whatcom Coalition.