by Eric Hirst
The long-running drought in the southwest has dramatically lowered flows in the Colorado River, and, therefore, the levels in Lake Powell and Lake Mead. The U.S. Bureau of Reclamation determined that demand for Colorado River water needs to be cut by 2 to 4 million acre-feet a year. (1)
Much of that reduction will have to come from agriculture, the dominant user of Colorado River water. The farmers appear willing to make these cuts if paid: “The dollars at play could be significant. A range of values are being discussed, but a center point is $1,500 per acre-foot [($/af]. If all 925,000 acres participated in the program, the total cost would be $1.4 billion a year.” (2)
Whatcom County faces similar but much less severe water supply and demand issues. The Water Resource Inventory Area 1 (WRIA 1) Watershed Management Board and others involved with local water issues generally agree that we need more water in the Nooksack River’s three forks, tributaries, and mainstem during the summer months. More water is needed to maintain the cool temperatures, higher dissolved oxygen levels, and access to habitat that salmon and other aquatic species need. We also must ensure a sustainable, long-term supply of water for farmers to grow their raspberry, blueberry, corn, hay, potato, and other crops. Finally, we need sufficient water for homes, businesses, and industry.
Water supply is declining largely because of climate change, which is shrinking glaciers, reducing snowfall, melting snow earlier in the year, and therefore decreasing summer streamflows. And, the need for irrigation water (farms, golf courses, lawns and gardens) is growing because summers are hotter and drier.
When comparing different projects to provide “new” water supplies, store winter water for summer use, or improve water-use efficiency, it is essential to have some idea of what water is worth. That is, how much are we, collectively and individually, willing to pay for water in $/af?
Although this is a simple question, the value of water varies dramatically over time and space. What if you are hiking in Death Valley in mid-August, have no water, and haven’t had a drink for six hours. Would you pay $1 for a quart of water? I would. That works out to $1.3 million/af.
Would you pay $1 a week to water your lawn, which might require a foot of water during the summer? For a 40’ x 10’ lawn, the price of water is $120/af. And, during the heavy rains and flooding of November 2021, water surely had a negative value.
The value of water varies with time, location, users, and uses. Nevertheless, we need some measure of its worth to compare and select projects that reduce the growing gap between increasing demand and decreasing supply. The next section reviews the prices (or costs) consumers currently pay for water. The subsequent section reviews several analyses of proposed supply and storage projects and their estimates of project costs and benefits.
Current Water Costs
A useful starting point is what water users currently pay. Most homes and businesses buy water from a local municipality, water district, or water association. Many rural households self-supply from a well on their property. I obtained rate schedules from a few of these many utilities: the cities of Bellingham and Lynden, Birch Bay Water & Sewer District, and PUD #1 of Whatcom County.
Most farmers pump their water from a nearby stream or from a groundwater well, and, therefore, do not face an explicit price for water. I searched for estimates of the capital and operating costs for the systems that deliver water to their fields. The capital costs include those to drill wells; install pumps, motors, valves, control systems and distribution lines; and pipe water to the fields. Operating costs are the electricity or diesel fuel required to operate the motors and pumps. (3)
I used these numbers to calculate the variable, fixed, and total (sum of variable plus fixed) costs per acre-foot for different classes of water users (Fig. 1). It is challenging to compare costs among these classes. The water provided by Bellingham, Lynden, and Birch Bay is fully treated, potable, and highly reliable (with redundancy built into the water-supply systems). The water delivered by the PUD is filtered but otherwise untreated and is therefore much less expensive. The water delivered to crops may be filtered but is not treated.
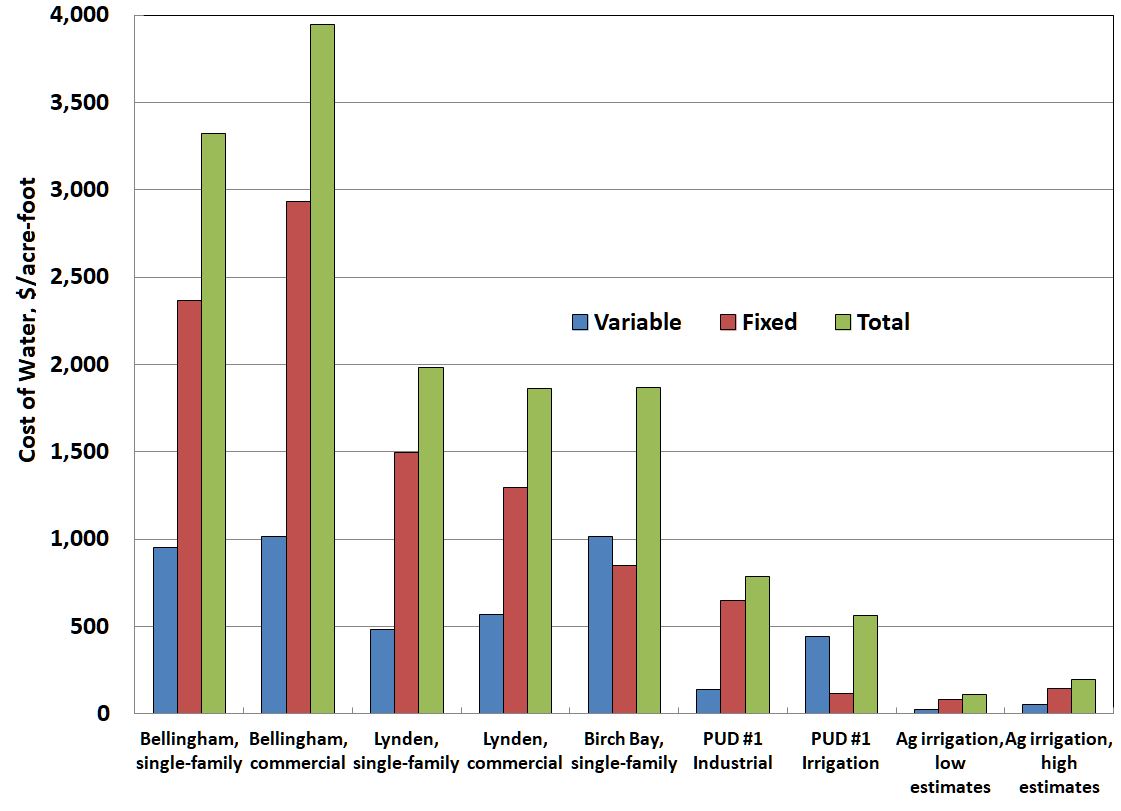
What can we learn from Fig. 1? The most important lesson is that the prices paid for water in Whatcom County vary tremendously among different groups of customers. Commercial establishments pay more for water than do households, which pay more than large industrial customers. Farmers pay the least. Roughly, Bellingham customers pay 20 times as much as do farmers, Lynden and Birch Bay customers pay 12 times as much, and the PUD industrial customers pay five times as much.
It is hard to know whether current costs should guide decisions on the relative merits of future water supply, storage and efficiency projects. Because people pay these prices, the numbers in Fig. 1 might represent lower bounds on the worth of water from new projects. The next section reviews some of the projects that have been proposed to reduce the supply/demand imbalance in Whatcom County.
Possible Future Projects, Costs
1. Non-Potable Water Study
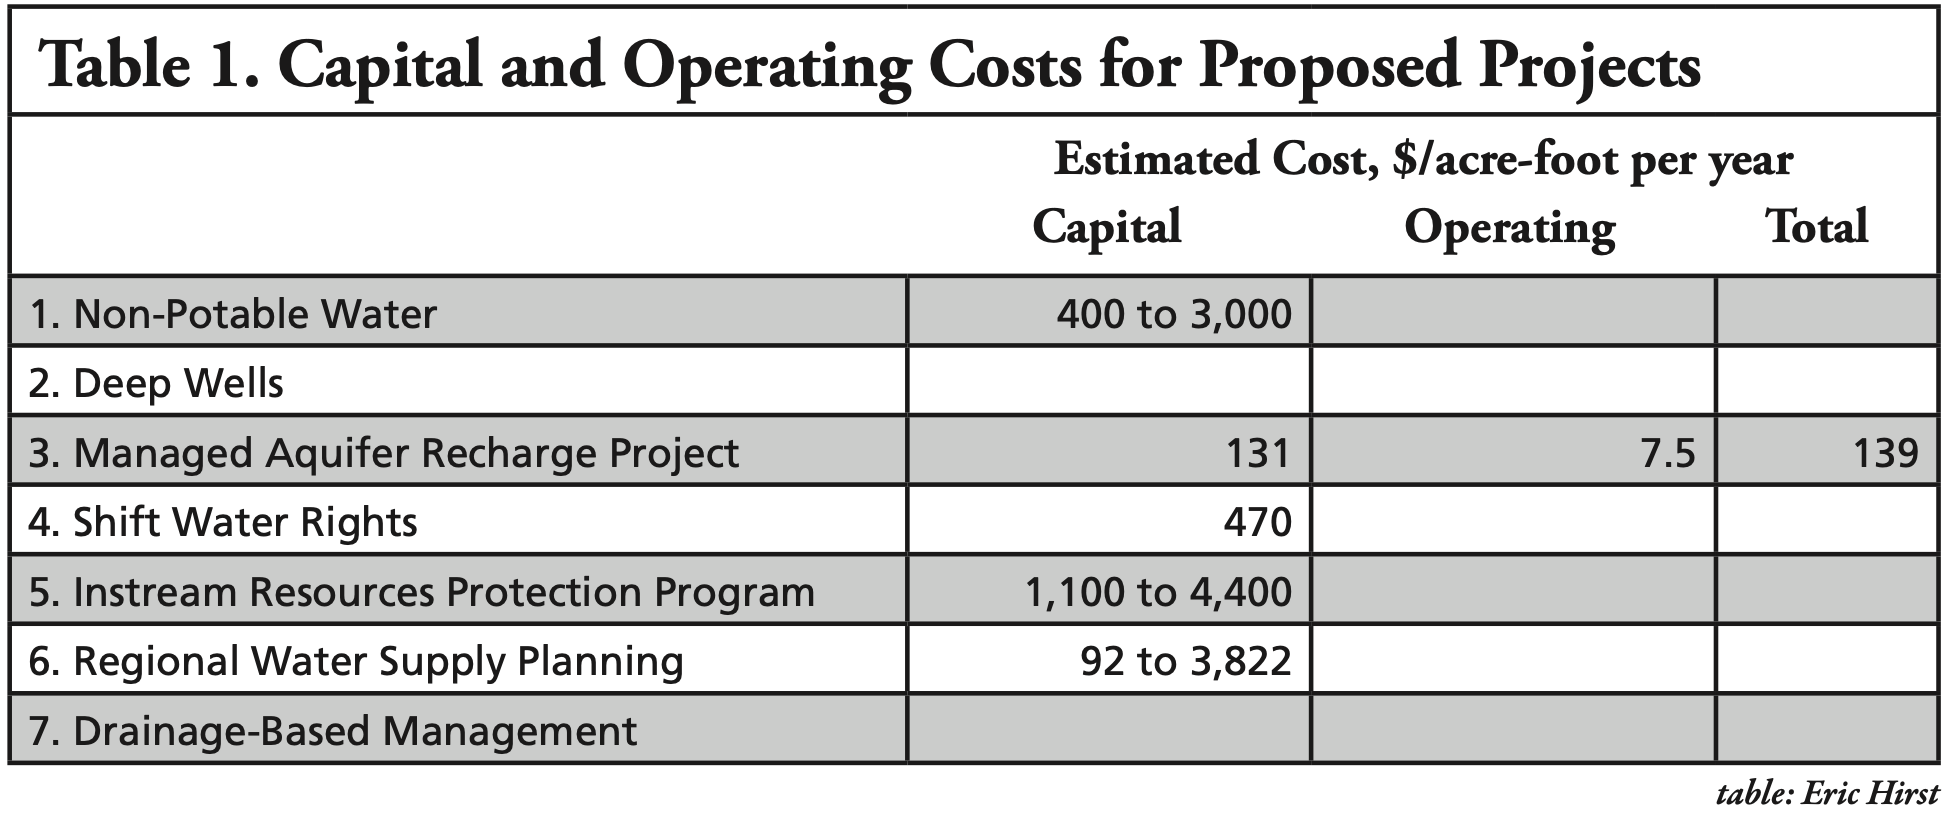
In 2009, the PUD commissioned a study of the costs to provide water to either the City of Lynden or to the Bertrand Creek watershed for agricultural uses and streamflow augmentation. The water would come from the Nooksack River, either from the PUD’s plant near Ferndale or from Lynden’s intake on the Nooksack River. The project assessed eight combinations of sources and delivery points. (4)The fixed costs (annualized capital costs, not including variable costs) range from about $400 to almost $3,000/af, a factor of seven. To date, none of these projects has been built.
2. Deep Wells
In 2015, the Birch Bay Water & Sewer District proposed to the Washington Dept. of Ecology (Ecology) to drill and test two to four deep wells (roughly 400’ deep). The purpose of this project, approved in 2016 for $700,000, was to determine whether reliable supplies of clean water could be obtained without impairing surface flows in western Whatcom County. (5)
Test results “conservatively estimated the sustainable yield of the Deep Aquifer to be 8,000 afy [acre-feet/year], without impact to surface water in the BGMA [Blaine Groundwater Management Area].”(6) These deep aquifer resources could provide water to various parts of northern Whatcom County, including municipal and nongovernment water systems that lack sufficient water rights, systems whose water quality is poor, and mitigation for agricultural irrigation. “For the purposes of this study, two general potential benefit areas have been identified … to the east and southeast of Blaine, and southeast of Birch Bay.” Although the project assessed several pipeline routes to deliver water to Lynden, Ferndale, and/or Cherry Point, the study included no cost estimates, neither for construction nor for operations. Therefore, it is not possible, even roughly, to estimate the cost of delivered water from these deep wells. (7)
3. Managed Aquifer Recharge Project
In 2020, the City of Lynden applied for and received a grant for $4.7 million from Ecology to explore locations where winter water could be stored and released through groundwater flows several months later to “increase flow in the Nooksack River primarily in June through October for habitat enhancement, stream flow augmentation, and water right mitigation purposes.”(8/9)
Several sites, primarily in the three forks, were examined where water could be withdrawn from November through April and then re-appear downstream between May and October. Initial estimates called for diversion of about 8 cubic feet/second into a 6-acre Managed Aquifer Recharge (MAR) Project facility. Lynden estimated an increase in seasonal streamflow of 2,340 af/year. Annual operating and maintenance costs were estimated as $35,000 every two years. These numbers, assuming a 30-year lifetime and discount rate of 5 percent, imply a total cost of water of $139/af-year.
4. Shift Water Rights
In early 2022, the Whatcom Ag Water Board (AWB) submitted a proposal to Ecology “to plan, implement and monitor up to 10 conversions of existing irrigation surface water rights to groundwater sources.” (10) The purpose of these conversions is to increase summer streamflows.
The estimated cost of this project is $8.54 million. The expected increase in summer streamflow (Bertrand, Tenmile and Fishtrap creeks; Schneider and Scott ditches; and Nooksack and Sumas rivers) is 1,182 af. (This benefit assumes that 100 percent of the shift from surface to ground water appears as increased flows in the creeks and rivers.) Thus, the capital cost is about $72,000/af. Assuming a 30-year lifetime and a discount rate of 5 percent, the annualized capital cost of increased supply is $470/af (not including operating costs, which are expected to be covered by the water-right holders).
5. Instream Resources Protection Program
As required by the 2018 Streamflow Restoration Act, Ecology issued a rule in 2020 that included several projects intended to mitigate (offset) the water expected to be used by residential permit-exempt wells in WRIA 1 between 2018 and 2038. The amount to be offset was calculated as 260 acre-feet/year of consumptive water use for the 2,150 homes expected to be built during this 20-year period.
From an initial list of 45 projects, Ecology selected 14 for inclusion in its plan: “The 14 projects and actions identified by Ecology in this document were chosen based on their likelihood of implementation and ability to achieve NEB [Net Ecological Benefit]. Ecology looked for projects with one or more of the following: an advantageous location in the watershed; likelihood for achieving offset and/or NEB; existing funding for the project provided by Ecology; existing funding provided by another entity; partner willingness; and, overall feasibility.” (11) In aggregate, the 14 projects were projected to increase streamflows by 3,767 af/year.
Ecology’s Regulatory Analysis provided capital cost estimates for three of the 14 projects, ranging from $17,000 to $67,000/af (not including operating costs); Ecology provided no explanation of how these costs were derived. (12) The annualized capital costs vary from almost $1,100 to $4,400 af/year.
6. Regional Water Supply Planning Project
The purpose of the Regional Water Supply Planning (RWSP) Project is to “establish a framework and identify possible solutions to address water supply needs for instream and out-of-stream uses.” Phase 1 examined three sub-basins: South Fork Nooksack River, Bertrand/Schneider Creek, and Drayton Harbor. (13)
The study assessed 32 projects, for which about half had complete data. The “30-year [capital only] cost per acre-ft of water ranged from $92 to $3,822.” Two of the top four projects focused on water supply:
• “Project to pipe water from PUD plant 2 upstream for stream flow augmentation in one or more tributary streams and provide water directly to users.” Because of data gaps, no estimate of cost per acre-foot was provided.
• “Birch Bay Water and Sewer District deep well project near Blaine.” The estimated capital cost for this project is $1,049/af-year. (This is likely the same project discussed earlier in this section.)
The treatment of operating and maintenance costs in this project excluded costs if an entity that would pay such costs was identified. For example, if the City of Lynden were to purchase water from a Birch Bay deep well, the costs to pump water from the wells to Lynden would not be included in this RWSP analysis, which underestimates total costs.
7. Drainage-Based Management
The key elements of the Drainage-Based Management (DBM) project, a close companion to RWSP, “include water supply, instream flow, water quality and fish habitat.” (14) The initial efforts focused on the South Fork.
The first strategy is to “Increase dry season instream flows.” This includes the following actions:
• “Convert surface water use to groundwater rights or withdrawals.”
• “Support natural surface water storage and infiltration processes … .”
• “Create surface water storage to re-time peak winter flows and support summer base flows.”
• “Create additional aquifer storage to provide stream flow benefits during the dry-season.”
However, this initial report provided no estimates of the streamflow benefits of these four strategies (e.g., increases in summer flows in cubic feet/second) and no estimates of the capital and operating costs for such projects.
Summary
This section reviewed several projects to increase summer flows in different parts of the Nooksack River basin. This review (Table 1) shows that:
• Most of the projects did not include sufficient information to estimate capital costs per acre-foot, either because they did not address costs and/or did not estimate streamflow benefits.
• Only one of the projects estimated operating costs.
• None of the few projects that did present cost and benefit estimates explained how they were derived.
• Therefore, it is not possible to examine and consider the overall costs of these projects to help decide which are worth pursuing.
The incomplete, partial estimates of costs show considerable range, from a low of $92 to a high of $3,800/af-year.
Conclusions
I am troubled and surprised by what this effort uncovered — several project proposals with zero, inadequate, or incomplete analysis. Without estimates, however rough, of the capital and operating costs and the benefits of different projects, it is not possible to responsibly rank projects and determine priorities.
Of course, $/af is only one of many criteria used to decide which projects to implement. Project sponsors might also consider support from local groups (e.g., tribes, county and city governments, farmers, and environmental organizations); challenges associated with environmental and other permits required before project construction can begin; availability of money to pay for the project; and adaptability of the project to a changing climate. But these additional considerations in no way obviate the need for cost and benefit estimates.
The Washington state Legislature authorized $300 million over a 15-year period to fund projects to offset the water to be used by rural residential permit-exempt wells. Ecology’s guidance to potential grantees is clear on the importance of quantifying benefits and costs for each project: (15)
• “Projects that would quantitatively improve streamflows are the highest single priority factor for funding in this grant round.”
• “… applicants are strongly encouraged to quantify the project’s impacts with verifiable data.”
• “Because this competitive grants’ initiative must make the best use of limited public funds, applicants should demonstrate that the proposed project provides benefits for a reasonable relative cost.”
• “Strong evidence that costs are based upon defensible and relevant data,”
• “Strong evidence that project provides benefits for a low relative cost.”
Benjamin Franklin said, “When the well’s dry, we know the worth of water.” This quote is an appropriate way to end this paper. Although not yet dry, summer water supplies in the Nooksack basin are declining and demand for irrigation water is increasing. It’s long past time for us to carefully assess and quantify the pros and cons of projects that would increase supply, reduce demand, or store winter water for summer use.
Endnotes
1. J. Partlow and K. Brulliard, “U.S. announces more water cuts as Colorado River hits dire lows,” The Washington Post, Aug. 16, 2022.
2. B. Walton, “Arizona and California Farmers, Targets for Colorado River Cuts, Draft Their Conservation Strategy,” Circle of Blue, Aug. 4, 2022.
3. Although I contacted several sources (staff at Whatcom County Extension Service, Washington State University – Prosser, Whatcom Ag Water Board; U.S. Dept. of Agriculture publications; and Puget Sound Energy data on electricity use for Whatcom irrigators), I was unable to obtain consistent, comprehensive numbers on the costs to provide water for local crops. The numbers shown on Fig. 1 are estimates, pieced together from disparate sources, which is why I show low and high estimates.
4. Murray, Smith & Associates, Inc., Non-Potable Water Study for City of Lynden and Bertrand Watershed Improvement District, for Public Utility District No. 1 of Whatcom County, May 2009.
5. D. Eisses and C. Lindsay, presentation on “Deep Aquifer Investigation Northwest Whatcom County,” Birch Bay Water and Sewer District, Feb. 2016.
6. CHS Engineers, North Whatcom County Regional Water Supply Feasibility Study – Phase 1, for Birch Bay Water and Sewer District, Feb. 2018. See also Associated Earth Sciences, Inc., 2017, Installation and Testing of Exploration Well EW-3, Birch Bay Water and Sewer District, Dec. 11, 2017.
7. To be fair, estimating the costs to construct and operate such a system depends on many factors: the miles and size of pipe, number of customers and the amount of water they use, the timing of their water use (year-round or seasonal), and peak and average customer use.
8. City of Lynden, “City of Lynden Nooksack River Managed Aquifer Recharge (MAR) Project,” Mar. 2020.
9. J. Chennault et al., “Nooksack River Managed Aquifer Recharge (MAR),” presented to Salmon Recovery Staff Team, Jan. 13, 2020.
10. Ag Water Board of Whatcom County, Surface Water to Groundwater Right Conversion Project,” proposal to Ecology, Feb. 2022. Ecology did not fund this project this year.
11. Ecology, Final Rule Supporting Document, Amendment to Chapter 173-501 WAC Instream Resources Protection Program – Nooksack Water Resource Inventory Area (WRIA) 1, Pub. 20-11-077, May 2020.
12. Ecology, Final Regulatory Analyses Including the: Final Cost-Benefit Analysis, Least-Burdensome Alternative Analysis, Administrative Procedure Act Determinations, Regulatory Fairness Act Compliance, Amendment to Chapter 173-501 WAC Instream Resources Protection Program – Nooksack Water Resource Inventory Area (WRIA) 1, Pub. 20-11-081, May 2020.
13. Aspect Consulting, WRIA 1 Regional Water Supply Plan Phase 1, Task 3. Water Supply and Management Solutions, for Whatcom County PUD #1, April 16, 2021. See especially Table 2E.
14. Kramer Consulting & Anchor QEA LLC, South Fork Drainage-Based Management Draft Report, July 14, 2022.
15. Ecology, Streamflow Restoration Competitive Grants, 2022 Pub. 21-11-019, Sept. 2021.
______________________
Eric Hirst moved to Bellingham in 2002. He has a Ph.D. in engineering from Stanford University, worked at Oak Ridge National Laboratory for 30 years as a policy analyst on energy efficiency and the structure of the electricity industry. He spent the last eight years of his career as a consultant. In Bellingham, he has continued his work as an environmental analyst and activist.