by April Markiewicz
When looking at the current water quality data for Lake Whatcom, our community’s primary drinking water source, it is starting to feel like nothing is changing. Those parameters that indicated stabilization or improvements (e.g., golden algal counts and chlorophyll concentrations, respectively) in the previous year’s data remain unchanged, as did those that indicated continued degradation (e.g., dissolved inorganic nitrogen and green algae, as well as blue-green bacteria counts).
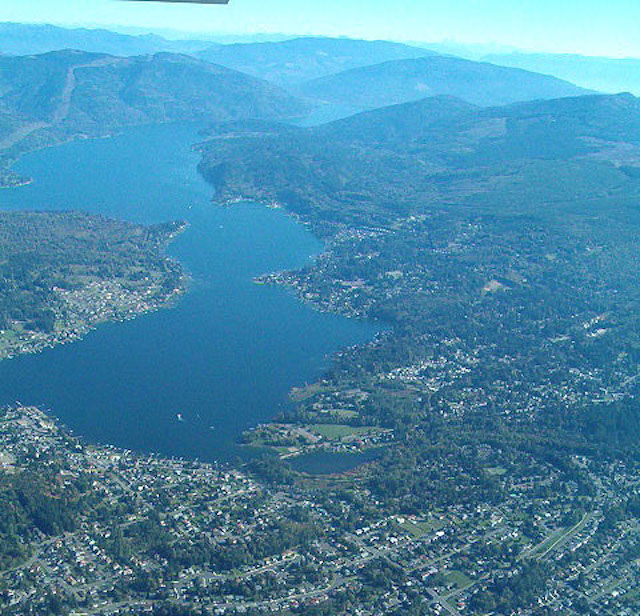
courtesy photo: City of Bellingham
The three sub-basins are visible in this photo. The northernmost basin 1 (foreground) is 95 feet deep, and is surrounded by residential development. Basin 2 is 69 feet deep and is the basin from which the City of Bellingham draws water. Basin 3, partially shown in this photo, is the largest in area, 328 feet deep, and contains 96 percent of the lake’s total volume.
It is therefore not surprising that, at the Lake Whatcom Management Program (LWMP) Joint Councils and Commissioners (JCC) meeting on April 2 of this year, the question was asked (again) whether we are making progress in slowing and possibly halting the decline in the lake’s water quality. According to Dr. Angela Strecker, Director of the Institute for Watershed Studies, whose research team conducts the ongoing water quality monitoring of the lake, the answer is yes.
She stated that, if drastic steps had not been taken over the last few decades by our community, the decline would have continued to accelerate, based on the rate and magnitude at which water quality data were failing to meet federal and state standards. Just look at the trends (slopes of the data in the enclosed graphs) that show a steep upward climb (or decline) in water quality parameters, indicating deleterious effects to Lake Whatcom up until the mid-2000s.
She added that our community’s drinking water source would have become so biologically productive (if we had not stepped up our efforts with concurrent funding and resource allocations) that we could have reached an inflection point from which the lake would never have been able to recover.
The cause of that decline is due to the over 170 years of our community’s activities and exploitation of the abundant natural resources in and around Lake Whatcom. A very comprehensive and detailed analysis of those activities can be found in Greene’s (2024) “History of Lake Whatcom.” By the end of his book, it is obvious why there is still development around the lake, as well as concurrent, continuing and subsequent severe impacts to the lake’s water quality. He does not, however, link those impacts to the current status of water quality in the lake.
Not surprisingly, our past activities resulted in the lake being listed as an impaired waterbody under section 303(d) of the Clean Water Act in 1998 for low dissolved oxygen from excess phosphorus and from fecal coliform bacteria entering the lake. We are now challenged (and burdened) with the highly daunting task of trying to intervene, stop, repair, and currently reverse the historical damage we have caused to our primary drinking water source. Moreover, we also have a stewardship responsibility to restore a highly valued aquatic ecological resource for all the aquatic and wildlife species that rely on it for their survival.

Our Efforts
Since the late 1980s, our community has spent tens of millions of our local taxpayer dollars on installing stormwater treatment systems in the developed, urbanized areas of the watershed, as well as bought undeveloped property from landowners, allocated more city and county staff resources and time to educate homeowners on using lake-friendly practices in the watershed, conducted aquatic invasive species inspections of boats each summer, and conducted annual studies of the lake’s water quality in our efforts to halt the decline and restore this vital community resource.
Guiding those actions have been the five-year Work Plans developed by City of Bellingham, Whatcom County, and the Lake Whatcom Water and Sewer District as part of the Lake Whatcom Management Team. Their respective staff have been instrumental in the planning and implementation of those plans and should be commended for their ongoing efforts.
The Work Plans are based on the TMDL (Total Maximum Daily Load) for phosphorus and E. coli bacteria loadings to the lake developed by the Washington Department of Ecology (Ecology) in collaboration with and support from those three jurisdictions and finalized in 2016 (Ecology, 2016).
In her presentation to the JCC, Strecker emphasized that our actions in the last two decades have prevented taste and odor issues in our tap water that would have required more costly treatment options, unsightly floating mats of rotting algae and seaweed in the surface waters, fish kills from low dissolved oxygen, increased anoxia during the summer to cause the resuspension of mercury, lead, and other metals from the sediments into the overlying water that would have threatened the health of humans, pets, and wildlife, prevented the introductions of aquatic invasive species that could potentially out-compete resident species and compromise our water treatment systems, and further promote accelerated degradation of water quality conditions that would favor the influx of toxic algal species.
Strecker added that trends in the water quality data in recent years have indicated the decline has slowed. Moreover, there are signs some water quality parameters have stabilized over the last 10 years. She cautioned, however, that the recovery of the lake is going to be a lengthy process that may take several more decades, if not longer. As such, the implications are that our community must still be diligent and dedicated to allocating the necessary funds and additional resources to expedite the recovery/restoration of Lake Whatcom.
What the Data Show
The most recent Lake Whatcom Monitoring Program Annual Report for 2023/2024 by Strecker et al. (2025) does show some signs that the lake may be stabilizing as nutrient inputs have been addressed with improved stormwater runoff treatment systems, as well as by educating residents in the watershed about actions they can take to reduce nutrient loadings to the lake. Those include infiltrating rainwater into their gardens and lawns, planting native species of plants, shrubs, and trees, decreasing the extent of impervious surfaces on their property, and using phosphate free fertilizer. A summary of water quality conditions in the lake for 2023/2024 is as follows:
- Most of the water temperatures in the three basins of the lake were within historical ranges, with stable thermal stratification in them by June.
- Once the lake becomes stratified, water from the upper surface layers are isolated from the colder, denser bottom waters and they do not mix. As a result, DO (dissolved oxygen) in the deeper layers of water is rapidly consumed by microorganisms, and, by July, concentrations at 14 meters were below 2 mg/L in basin 1 and to a lesser extent in basin 2. By August and September, the DO was at zero (see Figure 1). This pattern of complete anoxia by late summer and early fall in these two subbasins is unchanged from the last 20 years of data collection.

Figure 1. Trends in dissolved oxygen over time in basin 1 at 14 meters (~46 feet) sampled in July, August, and September from 1988 through 2024 (Strecker et al., 2025).
- Chlorophyll (Chl) concentrations, a direct measure of algal biomass and indicator of a lake’s biological productivity have increased significantly in all basins over time. The data, however, indicate that concentrations may have leveled off since 2010 and may be trending slightly lower (see Figure 2).

Figure 2. Median summer near-surface chlorophyll concentrations (June – October) at each sampling site from 1994 – 2024 (Strecker et al., 2025).
- Green algae (Chlorophyta) and Cyanobacteria numbers, in general, are continuing to increase throughout the lake compared to previous year’s data (see Figures 3 and 4, respectively). In late summer and early fall, they dominate the plankton biomass.

Figure 3. Log10 plots of median summer near surface green algae (Chlorophyta) counts from June through October all sites and depths (1994 – 2024) (Strecker et al., 2025).

Figure 4. Log10 plots of median summer near surface Cyanobacteria counts for each site (June – October) from 1994 – 2024 (Strecker et al., 2025).
- Total phosphorus (TP) in the surface waters was still measurable in basin 1, indicating potential ongoing inputs into the basin. In basins 2 and 3, however, TP was below analytical detection limits, indicating potentially less inputs, as well as rapid biological uptake and utilization (see Figure 5).

Figure 5. Median summer near-surface total phosphorus concentrations at each sampling site from 1994 – 2024 (Strecker et al., 2025).
- Dissolved inorganic nitrogen (DIN) concentrations in the surface waters continue to rapidly decline, especially in basin 1, and, by June, were below analytical detection limits (see Figure 6). Additional analyses of the DIN data, comparing spring versus summer DIN concentrations, found that summer utilization rates are continuing to accelerate and outpace spring rates. Moreover, Strecker et al. (2025) note that the DIN trend has not stabilized in recent years, most likely due to increased algal densities throughout the lake that use it for growth.

Figure 6. Minimum summer near-surface dissolved inorganic nitrogen (DIN) concentrations at each sampling site from (June – October)
- Total trihalomethanes (THMs) created during the disinfection process at the city of Bellingham’s Water Treatment Plant (WTP) continue to trend down in concentration. The installation of the Dissolved Air Flotation (DAF) pretreatment system at the WTP in 2018 removes organic particles from the raw lake water that interact with chlorine to form the THMs (see Figure 7).

Figure 7. Total trihalomethanes quarterly average concentrations in the Bellingham water distribution system (Strecker et al., 2025).
Planning for the Future
Under the direction of the Lake Whatcom Management Committee, comprised of the City of Bellingham Mayor, Whatcom County Executive, and Lake Whatcom Water and Sewer District General Manager, the Interjurisdictional Coordinating Team (ICT) comprised of staff from all three jurisdictions have developed the new five-year Work Plan (LWMP, 2025) for 2025 through 2029 to coordinate projects, programs, and activities as part of the LWMP.
This is the sixth five-year plan to date and is projected to cost approximately $70.9 million over the next five years (in local taxpayers funds) to implement (LWMP, 2025). City Councilmember Lilliquist estimated during the JCC meeting that at least $50 million has already been spent to implement the first five work plans. Given the current local, county, and statewide budget shortfalls being projected, however, it is no wonder that some of the council members asked about whether progress has been made enough for now so that resources could possibly be directed to other city/county priorities.
If so, it is not unthinkable for our community leaders to question whether further actions might still be needed at the same levels to restore, protect, and preserve our drinking water source. Can we continue to see improvements in the lake’s water quality, but not at such a crippling expense and commitment of so much money, staff time and resources? Probably not.
Strecker’s response, as noted earlier, was patience is needed. We have made progress in controlling nutrients entering the lake, but we still have a long way to go to facilitate the lake’s recovery. It is going to take a long time for significant improvements to be measured in the lake’s water quality data. How significant those changes will be is still to be determined and will depend on meeting the goals for phosphorus loadings specified in the TMDL. There is also the problematic issue of addressing the time it will take for the eventual sequester of phosphorus already present in the sediments.
Strecker explained when bottom waters in basins 1 and 2 become anoxic during the summer, precipitated (solid) phosphorus in the sediments will dissolve in the overlying waters. When the lake destratifies in the fall, surface and bottom water layers mix again causing metals (and phosphorus) to be recirculated throughout the lake. This causes another surge in biological productivity (eutrophication) in the lake, resulting in a surge in algal growth (referred to as internal phosphorus recycling (IPR)). Stopping that process cannot be accomplished by human intervention. Time and natural processes that will eventually bury the current phosphorusladen sediments will be the determining factors.
Commitment and Resolve
We inherited an overexploited and damaged ecological resource that is crucial to our current and future survival as the primary drinking water source for our community. Unfortunately, we waited too long to do anything to protect, preserve, and restore Lake Whatcom’s water quality, thereby allowing too much overexploitation and damage to continue to it and its surrounding watershed. Through our inactions, we accelerated the aging processes in the lake, causing much higher levels of biological productivity and expedited the lake’s eutrophication.
The ongoing cost and efforts by the three jurisdictions must continue unabated with full engagement, commitment, and resolve with support from our community and its leaders. There are no shortcuts available or acceptable half measures. Simply “making progress” with insufficient funds, staffing, and resources is not good enough. This effort to restore Lake Whatcom must be a top priority, though it is understandable that we may need to make sacrifices and possibly delay actions to address other emerging community- level issues.
Dr. Matthews, the former director of the Institute for Watershed Studies, stated years ago, that the lake will never return to its former, pre-1800s water quality conditions; however, the more we can do now to halt its decline, the longer we can rely on this local invaluable natural resource to support our current and future generations with clean drinking water.
___________________________________
April Markiewicz is an environmental toxicologist and recently retired as the associate director at the Institute of Environmental Toxicology at the College of the Environment at Western Washington University.
References
- Greene, H.L. 2024. “Lake Whatcom – A History.” The History Press, Charlston, SC. 205 pp.
- LWMP (Lake Whatcom Management Program). 2025. Lake Whatcom Management Program 2025 – 2029 Work Plan. 58 pp. Available online at Lake Whatcom Management Program: 2025-2029 Work Plan. https://cob.org/wp-content/uploads/LWMP-2025-2029-Work-Plan-January-2025.pdf.
- Strecker, A, J. Pickens, C. Archambault, E. Flarry, R. Mitchell. 2025. Lake Whatcom Monitoring Project 2023/2024 Report. Western Washington University. Lake Whatcom Annual Reports 31. 354 pp. Available online at: https://cedar.wwu.edu/cgi/viewcontent.cgi?article=1032&context=lakewhat_annualreps.