by Preston L. Schiller
Part 3
This is the third of a four-part article discussing the accomplishments and limitations of Whatcom Transportation Authority (WTA), the transit provider for Bellingham and Whatcom County. It salutes the many things WTA does well, from driver training to marketing and efforts to respond to its users needs, to keeping buses running in difficult weather, but it also explores how it could increase its ridership with a little help from the major and minor employers and institutions of Bellingham and Whatcom County. Parts 1 and 2 compared (WTA) with Kingston Transit (KT), the transit provider for the city of Kingston, Ontario — a city sharing several similarities with Bellingham and parts of Whatcom County.
This article is being written as the report of the city of Bellingham’s Climate Action Task Force is being circulated, widely discussed, and reviewed by Bellingham’s City Council. The task force’s transportation and transit recommendations are somewhat heavy on electrification and a bit light about how to increase transit ridership. A parallel effort on the part of Whatcom County should also generate a good deal of discussion and reflection upon this issue, and it will be interesting to see how it addresses transit.
It is hoped that government officials, especially at these two entities, will take note of the discussion and analysis presented in these articles. Notice of the lessons that can be learned from Kingston Transit’s successes has been taken in several Canadian cities and regions. Recently, the daily newspaper and the director of the regional government of Nanaimo (British Columbia), a city and region somewhat similar to Bellingham and Whatcom County, brought attention to the author’s Plan Canada journal article about Kingston Transit in order to inform efforts there to improve transit. (1)
Parts 1 and 2 addressed issues around WTA’s dramatic increase in ridership between 2005 and 2009, and its subsequent ridership stagnation or slow decline which persists to the present. This was compared with Kingston Transit, which began this time period as a rather lackluster and low-ridership system, but was policy and planning-driven to dramatically improve its services and ridership. Between 2009 and 2018, Kingston Transit more than doubled its ridership, a feat virtually unknown in North American cities.
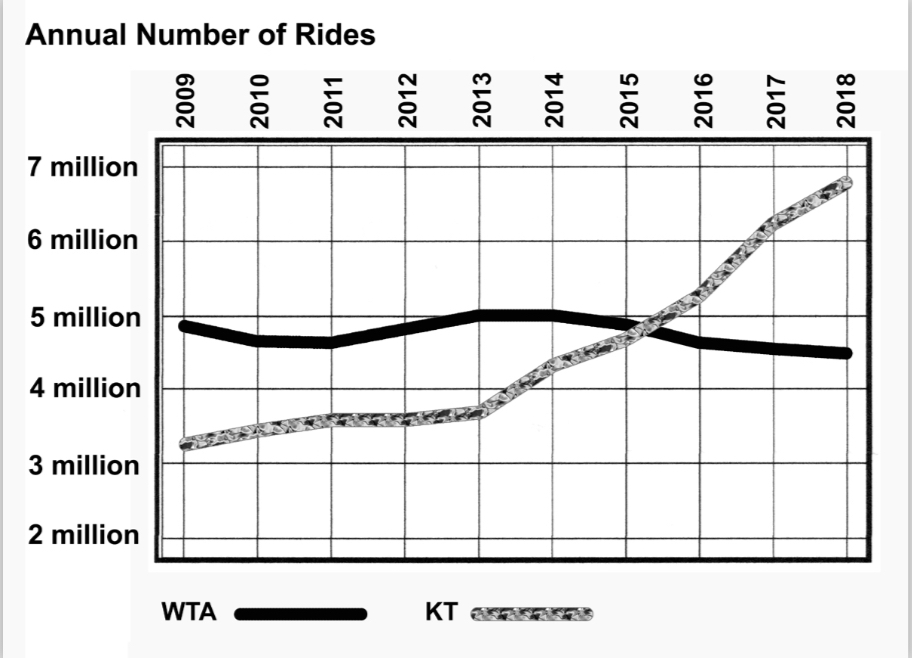
Kingston Transit was somewhat stagnant and lackluster in terms of rider- ship before introducing express routes and other innovations, then ridership rapidly increased. WTA’s ridership has been stagnant or somewhat diminshed during the same time frame.
Several of the factors behind Kingston Transit’s success were explored, especially its introduction of four frequent express routes servicing large areas of Kingston; its higher education, high school and youth passes and free fare policies; and its successful collaborative transit pass program with several major employers — especially the large hospital and medical centers. While Kingston Transit appears to be on a steady upward course of increasing ridership, it could benefit from more cooperation from several other major employers — some at provincial and federal levels of government.
Parts 1 and 2 also questioned the apportionment of services; whether it was wise or justified to increase costly service hours for out-of-Bellingham locations with sparse or declining ridership and oftentimes little support for transit in comparison to the needs of Bellingham — the major funder, supporter and user of transit.
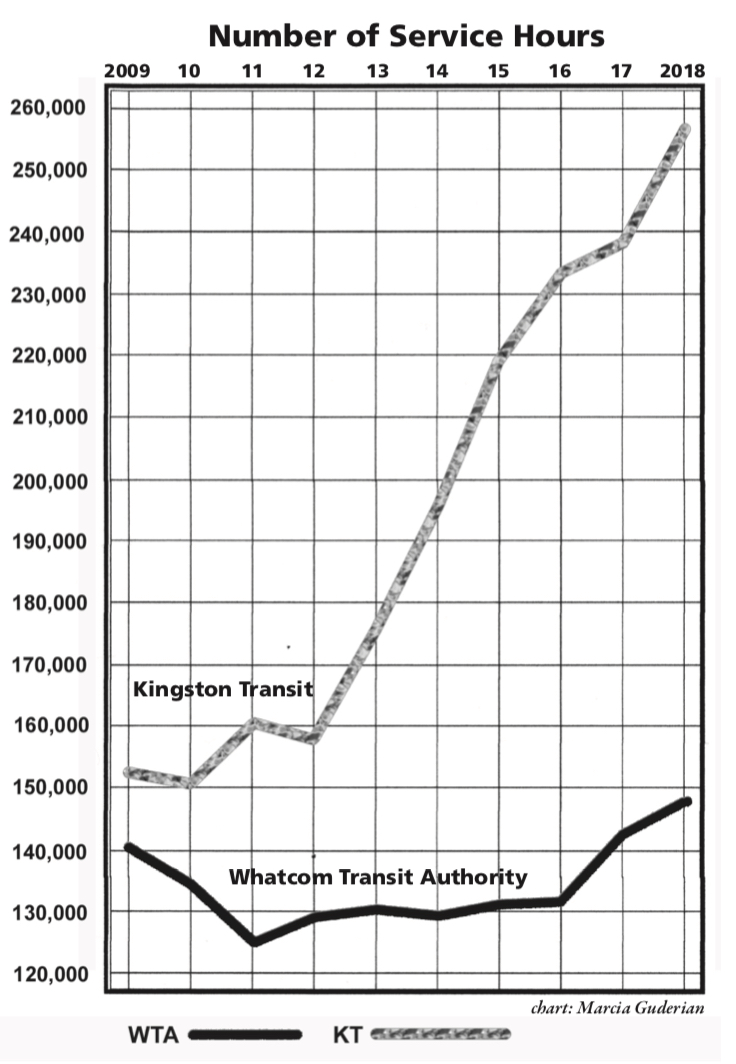
Kingston Transit’s provision of service hours increased at a slighly slower rate than its ridership, indicating more efficient use of buses; WTA’s provision of service hours seems to be more related to its sales tax revenues and board directives to cut urban services and increase rural services than to actual ridership demands.
All three parts address the burden that WTA’s rigid adherence to an antiquated planning system — having most of its routes pulse with each other downtown — places upon ridership growth and rider convenience. As discussed in Part 2, bus pulsing dictates the amount of time that a bus has to cover its route. If buses have to regularly pulse with numerous other buses on a schedule of once an hour, or twice an hour, or four times an hour, their routes can only be so long — either in distance or time. A bus system can only accomplish this by assuring that all the buses involved can maintain a certain average speed, or by building extra time into the schedules of each, or allowing faster buses more layover time at the pulsing point (such as the downtown or Cordata transfer centers) until the slower buses arrive.
A finely tuned pulsing system, where all the parts are efficiently synchronized, can provide an efficacious way of deploying buses. When traffic congestion, frequent stops, and slow passenger boardings delay even one part of the system, all parts of the system are slowed. Part 3 will offer ideas about how WTA could begin to move away from this limitation, informed by Kingston Transit’s successful efforts, as well as how the PeaceHealth St. Joseph’s Medical Center, the largest employer in Bellingham, could help WTA grow its ridership.
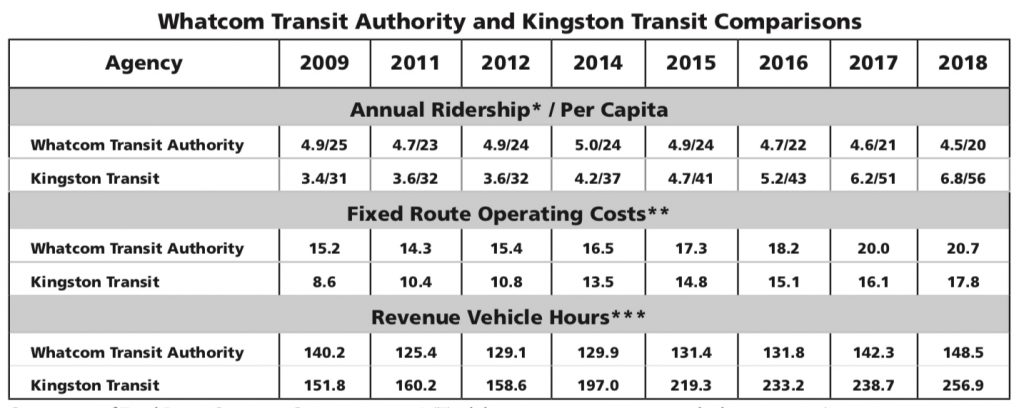
Comparison of Fixed Route Operating Costs; 2009-2018* (Total direct operating expenses; regular bus operations)
*Millions (rounded) **Millions of US$ (rounded) ***Hours that buses are carrying passengers (in thousands, rounded)
Sources: Various WTA and KT reports, budgets and plans; Washington Department of Transportation and National Transit Database reports
Overview of the Problem
The accompanying table (WTA and Kingston Transit Comparisons) and graphics derived from it (Annual Number of Rides; Fixed Route Operating Costs; and Number of Service Hours) illustrate some of the major issues involving WTA’s stagnant or declining ridership. The 10-year WTA and Kingston Transit data, from 2009 to 2018, demonstrate and compare the trajectories of ridership, fixed route (regular bus service) operating costs, and the number of hours that each system is carrying riders (revenue vehicle hours). (2)
It should be noted both systems predominantly serve urban areas that share many similarities: each hosts a university, a large medical center and hospital, and a well-defined historic central business district (CBD), as well as development patterns that range from compact and dense to sprawl, with malls and commercial strips along the way. Each transit agency has a unionized work force with comparable pay scales. Both share a history of service employment replacing fading or faded industrial presences.
In regards to annual total and per capita ridership, it is seen that Kingston Transit began the 2009-2018 period with considerably less total ridership than WTA, although its per capita ridership (the extent to which the service area population uses transit) was higher. WTA had dramatically increased its ridership between 2005 and 2009 as a result of improvements that were discussed in great detail in Parts 1 and 2 of this series. By 2009, with a small amount of variance, WTA appears to have reached a total ridership plateau. By 2016, it began a period of moderate total and per capita ridership decline. During the same time period, as a result of a policy and planning-driven transformation, Kingston Transit doubled its total and per capita ridership — virtually unheard of in North America.
In regards to operating costs and annual hours that buses are in service, Kingston Transit has significantly lower costs and offers much more service than WTA. Many Kingston Transit routes begin their days earlier and continue later into the evening than those of WTA. Both offer reasonable, though somewhat reduced, weekend services. Kingston Transit’s costs increase in proportion to its ridership growth, while WTA’s costs have risen despite ridership stagnation or decline. This has led to WTA’s rider subsidy rates being much higher than those of Kingston Transit. In other words, more ridership (Kingston Transit) translates into lower rider subsidies; sometimes more equals less.
There are many interlocking pieces of the puzzle of improving the use of WTA’s services. One large piece is WTA itself and its decades-long rigid adherence to route design and scheduling based upon most of its routes pulsing at the same intervals in its downtown transit center. But, there are numerous other puzzle pieces, which include government practices ranging from land use planning, codes and fee-setting to personnel policies; the locational and personnel policy practices of private sector employers and public institutions, such as hospitals and colleges; and the need for policy makers in public and private concerns to become more involved in transit and transportation issues with an orientation toward environmental and social sustainability. Our current private-motor-vehicle-over-dependent transportation system is unsustainable.
Routes, Frequencies and Information
There are several ways in which WTA can change from within that would be of benefit to itself and the communities it serves: These include changes to route structures, frequencies, and rider information provision.
As outlined in Part 2 of this series, forcing almost all of its routes to pulse, or lay over for several minutes in order to connect with each other at Bellingham Station (the downtown transit center) may have some advantages for a few very infrequent routes, and, arguably, for the efficient deployment of buses. But a pulsing and layover system forces routes to go out only so far from downtown and then return to meet the pulse. Thus, the rigid pulsing or timed-transfer system becomes the “tail that is wagging the dog” of operations and service planning — and it may not be in the best interests of attracting more ridership.
WTA has made some efforts in the direction of frequent service and moving a little away from pulsing with aspects of its more frequent GO Lines, but its system, overall, is still burdened by the pulsing system. When service is frequent, the rider does not have to worry about missing one bus or a connection with another; another will be along in a few minutes.
At present, WTA has two services that are frequent from beginning to endpoint: the 232 and 331, the Green and Gold Go Lines. Each connects downtown and Cordata by different routings. Several other routes centered on downtown, but with differing points of origin, do yoke together for part of their routings to form the Plum and Blue GO Lines. The process of “interlining,” which involves having a route entering the downtown transfer point transform into another route leaving the transfer point, does help some riders avoid having to change buses downtown — but this probably only affects a relatively small proportion of riders, and its inconsistency through the day can add to rider confusion.
It is possible to conceive of a system with many frequent routes serving the most important origins and destinations in Bellingham. Many could pass through downtown but would not need to pulse or lay over downtown. A few might be point to point by a routing more efficient than that of passing through downtown. A few of the necessarily less frequent, less in-demand, routes could be combined into longer routes that might obviate the need for pulsing. The relatively low transfer rate of WTA (previously discussed in Part 2) also calls into question the efficacy of the current pulsing arrangements and forced transfers. Those routes that fall outside of frequency or elongation through combination might still need to pulse. But, all of these possibilities could be informed by careful analysis that could be undertaken by WTA.
Changing from a rigid pulsed-transfer system to a frequent service system would take some pressure off drivers who sometimes feel the need to speed in order to make the pulse or need to call the bus dispatcher to see whether a passenger needing a transfer can be accommodated.
At present, WTA lists 27 routes whose numbers range from 1 to 540. Its numbering system does not appear to relate to an underlying purpose. If most routes were frequent, and, if several shorter routes were yoked together to create fewer but longer and more frequent routes, it could result in a simpler route structure, timetable and map, rather than the current 138-page “WTA encyclopedia” (a.k.a. Transit Guide). A reduced number of routes could result in a simpler identification system — perhaps alphabetical, which might be easier to remember, or an alpha-numeric pattern, which could combine location abbreviations and letters or numbers as in “WWU-1” or “WCC-3” or “WWU-WCC.”
Many transit agencies of similar or larger size (including Kingston Transit) are able to fit all their needed information for riders — route maps, timetables, fare structure, etc. — into a folding large one-page brochure. Some of these, such as the Montreal map, even have a level of detail that allows it to serve as a city street map in addition to transit map. WTA’s current plethora of routes and often-changing timetables can be confusing and off-putting for many current and potential riders. Online access to WTA information, including trip planning, allays, but does not fully remedy these issues. A smaller number of longer, more frequent routes would obviate the need to expand the downtown transit center; not all routes would come together at fixed times, and those passing through downtown would not park and idle as long as pulsing routes do.
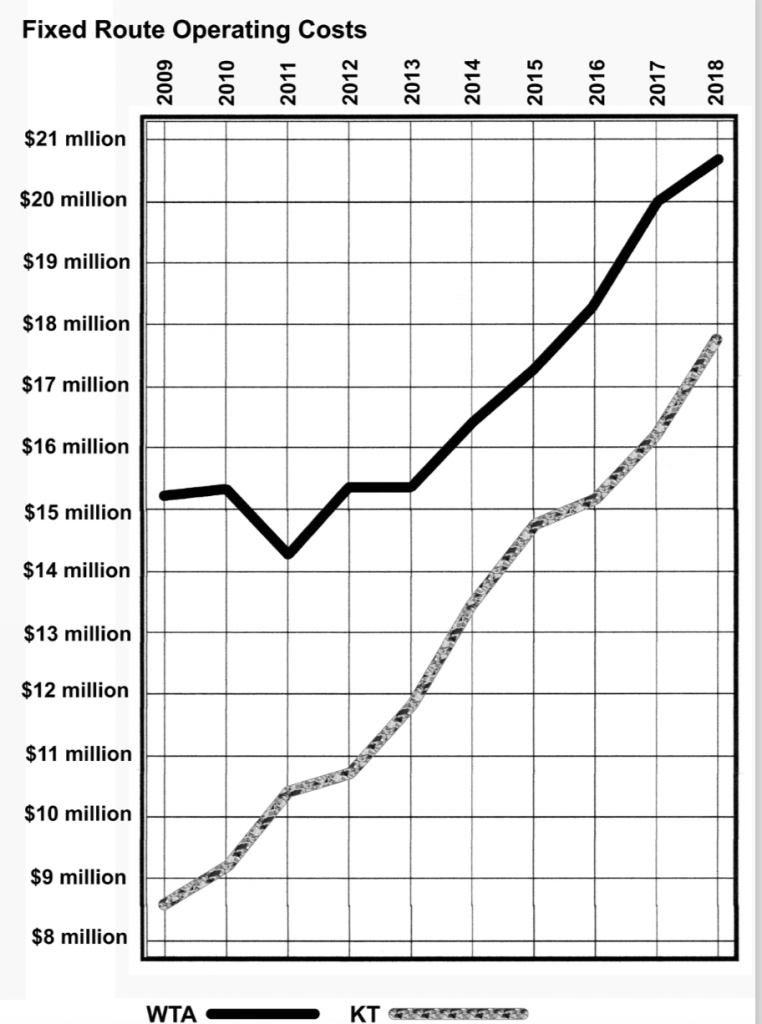
Kingston Transit’s costs are much less than WTA’s and have risen in pro- portion to its ridership growth;WTA’s costs continue to rise steeply despite diminishing ridership.
Reduce Costs, Broaden Reach
There are strategies that might broaden WTA’s reach and reduce some costs. The community at large generally appreciates transit services that provide mobility for persons who cannot easily get to a bus stop. But, there may be ways of merging some on-demand paratransit services with more cost-efficient regular bus services. All of WTA’s buses and minibuses are equipped to accommodate persons relying on wheelchairs, walkers, or needing low-floor or ramp access. Some merging of paratransit with regular routes is possible, even within the relatively demanding — and largely unfunded or underfunded — mandates of the federal Americans with Disabilities Act (ADA) requirements.
At present, WTA’s on-demand paratransit service accounts for approximately one-third of its operations budget, full-time employees (FTEs), total revenue hours of service (the amount of time the vehicle is available for riders), the mileage that vehicles tally, and most other accountable service costs. Yet paratransit only accounts for only 4.5 percent of the total passenger trips, and brings in revenues that amount to only 3.7 percent of the total fares collected. On average, a WTA paratransit minibus only transports 1.4 passengers per hour; that translates to a cost per ride of at least $40 or almost 10 times the cost of a regular bus trip. (3) While such important specialized services will always be more expensive than regular ones, there are ways that such a lopsided cost ratio could be reduced:
• If the rigid pulse system were abandoned, it would allow for flex-routing or “route deviation” of buses, building sufficient time into bus schedules or allow for certain times of day when regular buses could respond to a need to deviate from their routes to pick up passengers at or close to their residences. Sometimes a flex route is specified in a route’s map, other times it might simply be developed by the agency’s dispatchers and communicated to the driver. When armed with state of the art telecommunications, it would not require much advance notice on the part of the rider. WTA has implemented this a little on a Blaine route, but not on a systemic basis.
• In addition to flex-routing, WTA might explore the merging of paratransit trips for those with mobility issues with some other on-demand trips, especially in lower-density areas away from regular routes. This could also help WTA address some of the broader issues (first/last mile in transit lingo) of serving those riders who are not very close to a bus stop or regular service, and could be expanded for better weekend and evening service in some areas.
• When those needing paratransit assistance are reasonably close to a bus stop for a regular or frequent route, WTA could explore ways of helping that passenger reach the nearby stop or shorten paratransit trips to reach the closest transit center or bus shelter. The extent to which such passengers are “mainstreamed” into regular services is generally supported within the mobility challenged community.
• Many paratransit trips are to sites that benefit financially from these passengers, especially medical and shopping providers. Perhaps these beneficiaries could share some of the costs of these trips? There are also medical insurance coverages and several specialized services that do get reimbursed quite a bit for some patient trips; could WTA’s screening of paratransit riders include examining these and referring some passengers to these or billing insurance when possible?
• Some transit systems contract out some or all paratransit services to private sector services, including ride-hailing providers. Observations of WTA’s drivers indicate that they are very well trained to accommodate such passengers, while it is uncertain whether private providers would provide equally good service.
Could Vanpooling Be Expanded?
WTA’s vanpool is useful for some commuters, but, since it accounts for a relatively small number of trips, less than 50,000 annually, it is not addressed in this article — although its low cost-to-service ratio makes it an excellent candidate for more study as to how to expand this program. Perhaps vanpool programs would not need to be narrowly tied to a workplace commute? WTA seems to have missed an opportunity to try this a few years ago when Lummi Island residents organized what they hoped would become a year-round van service oriented to meeting the ferry, rather than just such a service when the ferry was in its annual dry dock. WTA had furnished a van for a limited period, but was unwilling to extend it, even though one of the Lummi Island organizers was a former bus driver.
It does not help to grow transit or ferry walk-ons when neither the county’s ferry service nor WTA drivers are communicating with each other about delays. It is commonplace to see a ferry arriving at Gooseberry Point just in time to miss the Route 50 bus connection — another issue created by the WTA pulsing schedule.
Employers Should Subsidize Transit Passes
The availability of free or cheap and convenient parking is one of the greatest incentives for solo commuting to work or to educational institutions or even for some discretionary trips. One of the proven best ways to grow transit ridership is to increase the price or inconvenience of parking — not necessarily an easy task in the world of malls and strips and motorist entitlements — while promoting improved service and transit passes.
WTA offers a number of affordable transit pass options. But it is hard for transit to compete with free parking. Many analysts have indicated — Donald Shoup is foremost among them — “there is no such thing as free parking.” Free parking at the workplace or school costs somebody a great deal of money: at least $50 to $70 per month per space for surface parking when all direct costs are tallied, and double that or more for structured parking. (4)
When parking is priced and scarce at the workplace — and good transportation options are available — parking cash outs and financial incentives for transit, walking or cycling can work well. Parking cash out is a process whereby an employer charges for parking and then uses the proceeds to subsidize employees with transit passes or rewards for those who regularly cycle or walk to work. Employers who adopt parking cash-out programs have been generally quite successful at managing and reducing the need for parking at the workplace. (5)
Pricing and limiting parking and promoting transit passes has several advantages for employers, foremost among these is the ability to develop space devoted to parking for other better uses. It also lessens employer burdens related to managing parking. Parking lots are often magnets for crime ranging from break-ins to assaults. Most parking lots are only used a limited number of hours per day or weeks, and represent a considerable managerial, maintenance and sunken cost. And parking lots, because of polluted and toxic run-off and heat entrapment, are anti-environmental in the extreme.
The collecting and managing of cash fares at the farebox is a significant problem for transit. It is a major source of delay for bus routes, rivaling traffic congestion, and a major source of friction between driver and rider. Imagine the rider fumbling through pockets for change or arguing with the driver about the amount due. A well and widely used transit pass program speeds up time at the farebox and allows the tech-savvy agency to gather valuable planning data.
In combination with existing GPS capabilities, and without compromising rider privacy, data can be collected about what type of rider boards and where — compiling vital information about ridership and transfers for route and capacity planning, scheduling and various operational needs. It also gives the agency a clear and precise picture of ridership without the clumsy periodical use of on-board clicker-counting or imprecise estimations of ridership and transfers. Additional tech features could allow the agency to count where and how many persons are getting off the bus.
Passes for the Masses
An interesting phenomenon occurs when individuals or a group of persons receive a transit pass in hand — even when they receive it as part of a group rather than as an individual: Some who were skeptical about using it — students at an institution where a fee mandating transit pass purchase was passed, for example, frequently find it very convenient to use it — occasionally at first, often with regularity after a while.
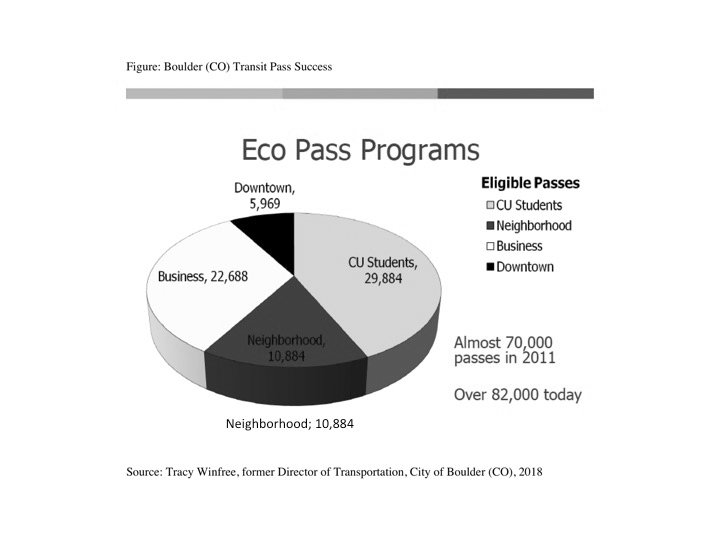
Business and neighborhood pride in supporting transit passes is an important ingredient in the success story of Boulder’s Community Transit Network.
Part of the success story of the Community Transit Network of Boulder (CO), besides the innovative planning of 10 locally focussed routes in a decade, was its transit pass program. The greatest initial users were the university students who participated in the design of the network and then passed a pass initiative. But once the network was in place and its frequent service proving itself to be very useful, it began attracting a variety of business and community interests. Special pass programs were designed for businesses of various sizes, and neighborhood organizations began to recruit pass purchasers. As the Figure (Boulder, CO, Transit Pass Success) indicates, at present over 80 percent of Boulder’s residents hold passes. The city is now exploring how to make transit passes universally available for all residents.
WTA is very well positioned to attract more worksite-oriented transit pass holders, if only more employers would step up to the mark. One very attractive, and under-publicized, program that WTA offers to pass holders and Smart Trips program enrollees is an Emergency Ride Home program: Employee pass holders who commute by bus (or walk or cycle) are entitled to a ride home should a need come up during the workday that cannot be addressed by regular bus service. Such programs offer a layer of security for bus riders and are generally not used or abused by employees in a costly way. (6)
Other WTA Changes
WTA often goes to great lengths to encourage citizens to comment on relatively small changes it is considering, such as minor schedule adjustments. But, it has not always been as diligent when it comes to enlisting citizen involvement in significant policy or planning changes. Such was the case of the rather weak 2015 Strategic Plan process, which did not take seriously the input of several of the citizens participating, some of whom brought considerable transit experience and expertise to that effort.
WTA probably benefits from some helpful review from the Citizens’ Transportation Advisory Group (CTAG) of the Whatcom Council of Governments (WCOG), a regional planning organization; three of the group’s members represent WTA. But CTAG’s effectiveness may be limited, as it only meets four times a year. One simple change that WTA could make would be to allow citizens to engage with its decision-making in ways that are more meaningful than the three minutes allowed at a monthly 8:00 a.m. board meeting at the Whatcom County Courthouse building.
Currently WTA is wisely reviewing its policies and rules in regards to accommodating e-bikes on its bus bike racks. There is a well-established synergy between cycling and transit use. Establishing a bikeshare program with docks located at important transit destinations, which can be found in many cities, might help grow bicycle and transit use and possibly reduce the pressure on the bicycle racks on buses. If some of the shared bikes were battery powered and could be charged at the docks, it would make Bellingham’s Climate Action Task Force very happy.
More Driver Discretion?
WTA might become a bit more user-friendly if it would reconsider its ironclad policy of directing drivers to only stop at marked designated transit stops, and to more rigorously review where stops are needed and where they are not. While most of these stops are at appropriate places, and have been screened for vehicle and passenger safety while stopped, there are many that are inappropriately located or would be better if moved or eliminated. The conventional wisdom in transit operations planning is that bus stops should generally be on opposite sides of the street from each other — a little difficult in downtown Bellingham where the traffic engineers went wild in the 1950s and 1960s creating an unwise one-way grid. (7)
The rule forbidding drivers to stop outside of a designated stop or pullover, except when that stop is blocked or inaccessible, does not allow drivers to exercise their own discretion about when and where to stop if necessity arises. If a passenger forgets to pull the cord signaling a need for a stop, or if the driver passes up a poorly lit sign, or a passenger is running to the stop but has not yet made it, well, too bad. Some transit systems have driver-discretion policies aimed at creating better security for some riders, such as unaccompanied women at night, allowing the driver to stop away from a designated stop to allow that person, and only that person, to get off without fear of being followed by a stranger.
Key Institutions Could Help
While there are some changes that WTA could make to help grow its ridership, there are many changes that could be undertaken by key Bellingham and Whatcom institutions that could help WTA grow its ridership, as well as help those institutions meet their aspirations of being responsible to the community and to the environment. Businesses can reduce their carbon footprints by pricing parking and promoting transit, walking and cycling to and from work, or even for some workday trips. Governmental entities and their employees at federal, state, and local levels could do more to reduce their negative community impacts while reducing their carbon footprints.
Peace and Goodwill Toward Cars
The PeaceHealth St. Joseph Medical Center is the oldest hospital in Bellingham, founded in 1890 by two members from the New Jersey-based Catholic order of the Sisters of St. Joseph of Peace. It is arguably the single largest employer in Bellingham and Whatcom County with 2,750 employees and 500 volunteers. It employs more persons than Western Washington University (WWU) when student part-time employees are not counted. It is the only hospital in the Bellingham-Whatcom County region, and it comprises many general and specialized medical clinics and outpatient services. It attracts over 400,000 patients annually to its facilities as inpatients, outpatients and emergency room users. Many more visit or accompany patients. As such, it is a major traffic generator. As a monopoly provider and major employer, it has considerable responsibility to its patients, staff and the community it serves.
PeaceHealth St. Joseph’s (PHSJ) moved from its location above State Street and below WWU to its current campus in the 1970s, and it acquired St. Luke’s Hospital (located at Jersey and Chestnut) in 1989. Both were centrally located, but neither had sufficient room for a major expansion. Today large and often underused parking lots abut the former St. Luke’s, which is now a PeaceHealth outpatient facility. The current St. Joseph’s campus is located fairly close to the Sunset interchange of I-5, but it also encroaches upon a residential neighborhood to its south and a large wetlands to its north. Its main access from Sunset Drive is along the primarily residential Ellis Street, whose residents would justifiably fight any expansion of that street. Ellis is reasonably bikeable between Sunset and downtown, but not from Sunset to Squalicum.
This example of poor urban planning and zoning was made worse over subsequent years as medical and health-related facilities began to sprawl along Squalicum Parkway in both directions away from the main hospital and medical center site. And, more low-density medical and commercial sprawl occurred along Northwest Drive and Bakerview Road as a result of poor planning. City and many citizens alike then bemoan the growing traffic congestion along these roads — and call for their expansion. But careful transportation analysis and research have demonstrated that expanding motor vehicle facilities to meet traffic demands and encouraging low-density development only worsens the situation by generating more traffic — the so-called “field of dreams” phenomenon of “if you build it, they will come.”
Gotta Have That New Road
One transportation issue that PeaceHealth worked hard over many years to influence in its favor is the Orchard Drive Extension, a new arterial planned to connect Birchwood Avenue-Squalicum Parkway with James Street with a route that goes under I-5. PeaceHealth’s efforts were strongly supported by interests which also stood to benefit from the new road. The route was originally an abandoned BNSF railroad bed that has long been planned for a segment of the Bay to Baker bicycle and walking trail. A part of the former railroad right-of-way has been retained by BNSF, and other segments were acquired by adjacent interests such as the Talbott’s Bellingham Cold Storage and other development interests. These interests were willing to cooperate with the creation of a trail only if the city coupled it with a new arterial. Now they are being rewarded with a new arterial serving their facilities offering the possibility of developing some land that previously could not be developed.
Costs Will Approach $20 Million
Early on the city was planning to hijack the railbed for much of its arterial’s footprint and relegate the trail to the adjacent wetlands area. It even admitted that parts of the wetlands trail would not be usable at certain times of year. After attention was brought to this hijacking, and after the city discovered that there was a pipeline under the railbed, it adjusted its plans to leave the trail atop the railbed and reroute the road to higher, less explodable ground to its side. (8) Despite knowledge of the “Field of Dreams” phenomenon, the city’s traffic engineers still promote this new road as a solution to traffic congestion and a safety improvement for the hospital. (9)
Doing special interests the favor of a new road is hardly cheap: $9 million in a 2011 city estimate; $12.1 million in the latest — and construction has not yet begun, so costs will likely rise considerably. Confounding these costs is the uncertainty hanging over supporting state funding due to the latest successful Tim Eyman Initiative 976, which could lead to special interests pressuring the city to make more funding available from its coffers. When the city’s traffic department became interested in building another new road, it also activated addressing the environmental and anti-salmon mess of Squalicum Creek and the Bug Lake wetlands. This salutary aspect of Public Works and environmental planning will likely cost at least $5 million in loans and grants to complete. (10)
Management Is a Major Problem
At present, no one driving to PeaceHealth St. Joseph pays for parking. Areas for patient and visitor parking are separated from employee and staff parking. As the medical complex grows, especially in outpatient care, it attracts more vehicle trips. Employees and staff are expected to register and affix identifiers to their vehicles, but anecdotal evidence suggests that some are encroaching on visitor parking areas. This chaotic situation can result in visitors being late for appointments or having to walk long distances from where parking is available. PeaceHealth has just recently commissioned a consultant study to advise it on promoting less solo car commuting by its employees. Its preliminary report is expected in February 2020, and it would be helpful if interested citizens and transportation agency staff could join in its review and discussions.
While not many persons would take the bus to the emergency room, there are probably a certain percentage of PeaceHealth employees, outpatients and visitors who could welcome a greatly improved transit service that fit their schedules and mobility needs. There are several transportation management measures PeaceHealth St. Joseph could enact that would be beneficial to their employees, outpatients and visitors, as well as the wider community:
• Study the origins and destinations of trips to the medical center in order to inform its transportation management planning. This data is readily available through human resources and patient records, and can be collected without breaching anyone’s privacy. Large institutions, like PeaceHealth, often analyze such data for decision-making about where to locate new facilities, etc.
• Charging for employee and staff parking with a parking cash out (11) and emergency ride home program as part of a WTA pass and vastly improved service and scheduling. At least, it might encourage some carpooling among employees who might not live near a bus line but might live near a few other employees.
• Charging for outpatient parking: PeaceHealth already regulates parking for outpatient surgery patients. Fees could be included in an office visit permit — costs could be borne by clinics or insurance coverage.
• Charging for visitor parking: This would be a more difficult sell, but might become possible after PeaceHealth begins charging for employee-staff parking. It would require a fair amount of public education, groundwork and much improved transit service. The well-located and transit well-served Kingston General Hospital and Hotel Dieu Medical Center charge considerable amounts for parking.
• Working with WTA to improve bus access to certain of its facilities or entrances which, at present, are not designed to accommodate a full-sized bus or bus turnaround.
Next Month:
Part 4: The final part in this series will explore what other Bellingham and Whatcom employers, institutions and the citizenry could do to help WTA grow transit and expand its services while realizing efficiencies
Endnotes
1. Regional District of Nanaimo Regular Board Meeting, Dec. 10, 2019, Item 12.1; also covered in the Nanaimo News Bulletin, Dec. 18, 2019.
2. Data informing tables and graphs and assertions in this article are derived from WTA and Kingston Transit websites and reports, as well as compilations by the Washington State Dept. of Transportation, the Province of Ontario, the U.S. National Transit Database, and the Canadian Urban Transit Association.
3. National Transit Database (NTD) 2017.
4. Donald Shoup (2005, 2011), “The High Cost of Free Parking.” Planners Press, American Planning Association.
5. Ibid.
6. www.ridewta.com/getting-around/transportation-services/emergency-ride-home
7. To be discussed more in the upcoming Part 4.
8. Preston L. Schiller, September 2010, “Hijacking the Bay to Baker Trail,” www.whatcomwatch.org/php/WW_open.php?id=1217.
9. As I gathered information about the hijacking, I queried (then) Bellingham City Councilmember and fire prevention professional Stan Snapp as to whether the Bellingham emergency services ever had problems getting to PeaceHealth St. Joseph; he answered “no” and did not see a public safety reason for building the new road.
10. www.cob.org/Documents/pw/transportation/ADOPTED_2019-2024_TIP.pdf; www.cob.org/documents/parks/development/projects/orchard-street-extension-report.pdf;
www.cob.org/Documents/pw/environment/restoration/squalicum-creek-re-route/squal-creek-corridor-projects-presentation.pdf
11. Parking cash out refers to programs where employers use the fees they charge for parking to subsidize transit passes or other benefits for those who commute by bus, bicycle or walk.
_______________________________
Preston L. Schiller is the author of “An Introduction to Sustainable Transportation: Poli-cy, Planning and Implementation, 2nd ed. revised,” 2017. In the 2000s, he led an ex-change between Bellingham and Boulder (CO). He teaches in the University of Washing-ton’s Sustainable Transportation Master’s program and has taught at WWU’s Huxley College and Queen’s University (Kingston, ON). He led the preliminary research and planning that created the express bus routes connecting Bellingham, Mount Vernon and Everett. He has served on many government advisory committees, and chaired the 1990s Policy Committee of the Governor’s Commute Trip Reduction Task Force.

