Editor’s Note: The Lake Whatcom Monitoring Project was initiated in the 1980s to measure and track long-term lake data for temperature, pH, dissolved oxygen, conductivity, turbidity, and nutrients, including nitrogen and phosphorus. The work is performed by WWU’s Institute for Watershed Studies and funded by the city of Bellingham. This is the 17th article April Markiewicz has written about the Lake Whatcom Monitor Project for Whatcom Watch. Monitoring project reports back to 1991/1992 can be accessed at: https://cedar.wwu.edu/lakewhat_annualreps/. Whatcom Watch articles from 2005 to 2015 can be accessed at: http://www.whatcomwatch.org/php/search.php Put Markiewicz in the search box and select author from the pull down menu. Whatcom Watch articles since 2015 can be accessed at: https://whatcomwatch.org.
by April Markiewicz
About Lake Whatcom
To understand the data, one must first know a little about Lake Whatcom. It is comprised of three subbasins that are partially separated from each other by underwater sills. Basin 1 is the northernmost subbasin (see map) and is about 100 feet deep. Basin 2 is between basins 1 and 3 and is about 80 feet deep. Basin 3 is the southernmost subbasin and is about 350 feet deep. Basins 1 and 2 each hold about 2 percent of the lake’s water, whereas basin 3 holds 96 percent.
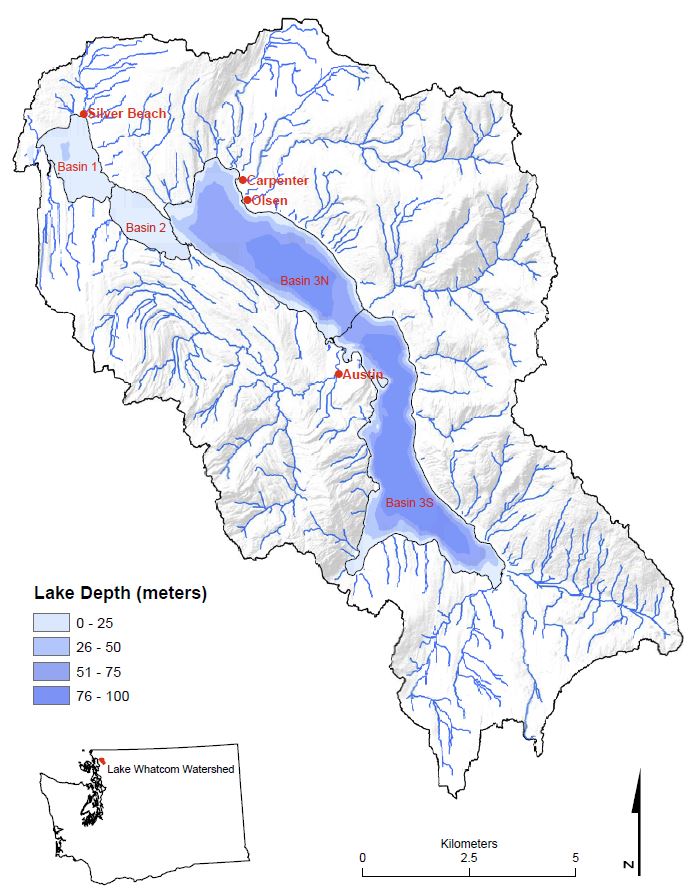
Lake Whatcom watershed and subbasins (Strecker et al., 2021).
Basin 1 showed signs of degraded water quality first. Its shorelines and watershed were used extensively for over 100 years for timber production, residential development, and recreation. As urbanization expanded southward, basin 2 began to show the same patterns in water quality degradation as basin 1. Within the last 10 years, basin 3 is also showing similar signs of water quality degradation.
Lake Whatcom is the primary drinking water source for about 100,000 residents of Whatcom County. The lake is comprised of three sub-basins from which water samples are collected in October through December, in February and April through September each year. The northernmost basin 1 (sample Site 1) is the smallest in area, 100 feet deep, and is surrounded by residential development. Basin 2 (sample Site 2) is just south of basin 1, and is second largest in area, 40-60 feet deep. Basin 3 (sample Site 3 (north) and Site 4 (south) is the largest in area, 328 feet deep, has the Sudden Valley residential subdivision along a western part of it and contains 96 percent of the lake’s total volume. Residential development in the Site 4 sub-watershed is sparse.
Since the mid-1980s, the Institute for Watershed Studies at Western Washington University has been collecting water samples, analyzing them, and reporting on the status of the lake as part of a long-term monitoring project for the city of Bellingham. Additional water quality data dating back to the 1960s also exists and have been used to provide an invaluable record of the lake’s decline over time.
The lake has been listed since 1998 as an impaired waterbody under Section 303(d) of the Clean Water Act. Once listed, the act requires that the waterbody must be cleaned up to meet state water quality standards by the persons or persons responsible. The city of Bellingham, Whatcom County and the Lake Whatcom Water and Sewer District have formed a Lake Whatcom Management Committee to direct the restoration and preservation of the lake and its surrounding watershed. The annual Lake Whatcom Monitoring Program provides long-term baseline water quality data on the lake, its tributaries, stormwater runoff treatment facilities around the lake, and hydrologic data to help the Lake Whatcom Management Committee in its decision-making and resource allocations.
About Dissolved Inorganic Nitrogen (DIN)
DIN is the most bioavailable form of nitrogen for algae and bacteria to assimilate for growth. As a lake becomes more productive (eutrophic), the processes of nitrogen assimilation by these species intensifies. Once it is depleted, undesirable species like blue-green bacteria (Cyanobacteria), can obtain nitrogen from other sources, and outcompete the other species.
They cause odor and taste problems in tap water, clog filtration and treatment systems, form huge decomposing mats on the surface of the lake, and produce toxins that can harm wildlife, waterfowl, pets, and humans. Loss of DIN from the water column therefore creates water quality conditions that promote Cyanobacteria growth and increases the risk of toxic species becoming established in Lake Whatcom.
There is speculation that the accelerated loss of DIN in the water column in 2020 is due to less nitrogen entering the lake over time. The removal or repair of septic systems in the watershed, as well as the installation of stormwater treatment systems around basin 1 are cited as reasons for the decline. For example, in the spring of 1995, the concentrations of DIN in the water columns of basins 1, 2, and 3 were approximately 380 ppb, 420 ppb, and 400 ppb, respectively (see Figure 8).
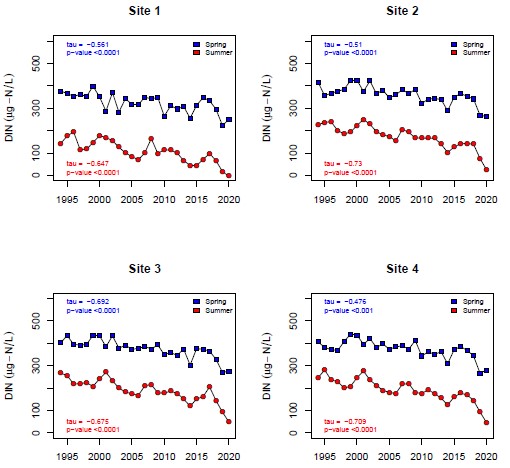
Figure 8. Comparison of median spring (February – May) vs. summer (June – October) near-surface DIN con- centrations from 1994 – 2020 (Strecker et al., 2021).
In the spring of 2020, those concentrations were approximately 250 ppb, 250 ppb, and 270 ppb, respectively.
This theory, however, ignores the fact that human activities, and urban development in the watershed have continued over that same time period. A more likely explanation, based on the data, is that increased nutrient inputs into the lake have facilitated the growth of certain species of algae and other phytoplankton. These r-selected species are short-lived, fast-growing species capable of rapid colonization of habitats that have abundant resources and are relatively unoccupied by competing species (Wetzel 2001).
As Lake Whatcom’s biological productivity has increased over the years due to continued inputs of nutrients (phosphorus, nitrogen, and carbon), these species have proliferated and are depleting nutrients from the water column more rapidly than was occurring 20 to 30 years ago.
We have to remember when examining the data: Lakes are ecological systems that are dynamic and contain aquatic populations, as well as complex communities that change over time.
Lake Whatcom’s Decline
Lake Whatcom, our community’s primary drinking water source, is declining in water quality every year despite all our current efforts to stop it. The cause of its decline is a direct result of our activities in its watershed over the last 140 years and includes those still being allowed today. Logging, mining, roadbuilding, recreation, and especially residential development within the watershed have been the main drivers of this decline. They have generated chemical contaminants, as well as physically altered the surrounding watershed landscape, resulting in the release of particles, nutrients, and organic matter that have all flowed unchecked into the lake over the years.
Due to its morphology, hydrology, and size, the decline in Lake Whatcom’s water quality was initially gradual. In time, however, constant and increased loadings of contaminants, particles, and especially nutrients into the lake from its surrounding watershed caused that decline to accelerate, especially in the last 25 years. In 1998, Lake Whatcom was listed on the Environmental Protection Agency 303(d) list as an impaired waterbody due to low dissolved oxygen levels caused by those nutrient (specifically phosphorus) loadings.
Actions have been taken since then by three jurisdictional entities responsible for the lake — the city of Bellingham (the water purveyor), Whatcom County, and the Lake Whatcom Water and Sewer District — to address phosphorus loadings to the lake. Those actions included installing stormwater runoff retention and treatment systems in the watershed, working with and educating the homeowners there to be stewards of our community’s drinking water source, enforcing land use policies, enacting land preservation actions to keep land from being developed, and making changes to operations and maintenance conducted in the watershed. The cost in taxpayer money has been in the millions of dollars each year. As of 2020, the annual cost was $11,152,467 (LWICT 2021 — see References).
The goal, set in the Lake Whatcom Total Daily Maximum Load (TMDL) report by the Washington Department of Ecology (Hood 2016), is to reduce phosphorus loadings to the lake by 87 percent (i.e., remove 3,150 pounds of phosphorus per year from entering the lake) (see Figure 1 ).
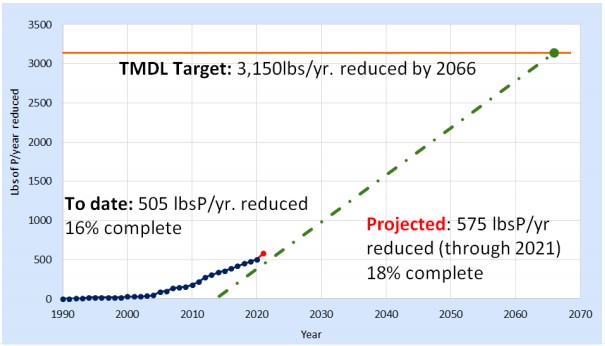
Figure 1. TMDL Response: Phosphorus Reductions Graph (LWJCC 2021).
That reduction, based on the TMDL modeling output, would match runoff conditions entering the lake that one would find from forested lands. Our community was given until 2066 to meet that goal, and, as of 2020, we are at 16 percent, with 505 pounds of phosphorus being prevented from entering the lake per year (LWJCC 2021).
Theoretically, that still leaves about 2,600 pounds of phosphorus entering the lake this year. That amount, however, could be more (or less) because the TMDL model was based on past water quality data and lake conditions. Given the fact that logging, roadbuilding, residential development, and recreation has been allowed to continue in the watershed, the more likely probability (and based on recent water quality monitoring data) is that additional amounts of phosphorus are still entering the lake.
Annual Lake Monitoring Background
Monitoring of the water quality in Lake Whatcom started in the mid-1960s, but wasn’t implemented as an ongoing long-term annual monitoring effort until 1988. Since then, the data have provided crucial evidence that the decline in the lake’s water quality was rapidly accelerating. With the 303(d) listing of the lake in 1998, the subsequent TMDL study in 2001-03, and implementation of phosphorus source control measures, the annual monitoring data has enabled the three jurisdictional entities to evaluate the effects of their efforts on slowing or halting the decline.
By 2014, Matthews et al. (2015) reported that, according to the latest data from the 2013/2014 monitoring period, “chlorophyll concentrations, as well as algae and blue-green bacteria numbers appear to have stabilized since 2004.” Cautious optimism reigned that efforts were being effective in slowing or even halting the decline in water quality.
And yet, during this same time period, residential development, logging, roadbuilding, and recreation were allowed to continue in the watershed. Granted that with the help of community members and elected officials, these activities were restricted to reduce their impacts on the lake, they were not stopped. Some have cited the lack of political willpower to impose stricter limitations or stop these activities years ago, whereas others cite the lack of resources, jurisdictional powers, and public support.
The end result is we have increased the aging process of Lake Whatcom by hundreds if not thousands of years, and, thereby have put our community’s primary drinking water source at risk. The most recent water quality data in the Lake Whatcom Monitoring Project 2019/2020 Report by Strecker et al. (2021) shows that the degradation may have slowed, but it is still continuing. Moreover, one water quality parameter, dissolved inorganic nitrogen (DIN), indicates that the degradation may once again be accelerating.
What the Data Show
Key points from the 2019/2020 Lake Whatcom Monitoring Report (Strecker et al. 2021) are as follows:
• Indications of continued eutrophication (increased biological productivity) in Lake Whatcom persist.
• Chlorophyll (Chl) concentrations, a direct measure of algal biomass and indicator of a lake’s biological productivity, are continuing to increase in basins 2 and 3 (see Figure 2).
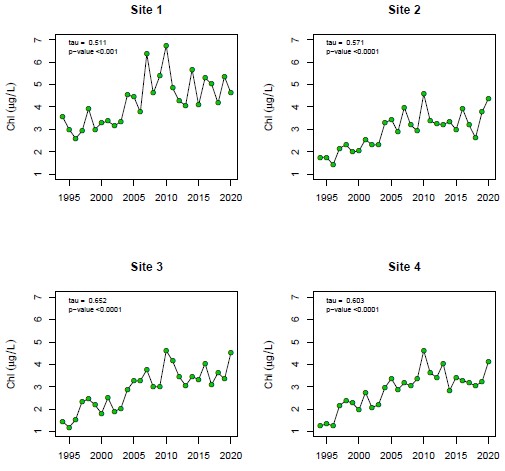
Figure 2. Median summer near-surface chlorophyll concentrations (June – October) at each sampling site from 1994 – 2020 (Strecker et al., 2021).
• Concentrations of chlorophyll in basins 2 and 3 are now the same as in basin 1.
• Green algae (Chlorophyta) numbers, in general, are continuing to increase throughout the lake compared to previous years’ data (see Figure 3).

Figure 3. Log10 plots of median summer near-surface green algae (Chlorophyta) counts from June through October all sites and depths (1994 – 2020) (Strecker et al., 2021).
• Blue-green bacteria (Cyanobacteria) are also continuing to increase throughout the lake (see Figure 4), especially in basin 3 (see Figure 5).

Figure 4. Log10 plots of median summer near-surface Cyanobacteria counts (June – October) from 1994 – 2020 (Strecker et al., 2021).

Figure 5. Log10 plots of median summer near-surface Cyanobacteria counts for each site (June – October) from 1994 – 2020 (Strecker et al., 2021).
• Total phosphorus (TP) concentrations in the surface waters (≤ 16.5 foot depth) of basins 2 and 3 are rapidly depleted due to biological uptake and are below analytical detection limits by June due to high biological activity (see Figure 6).
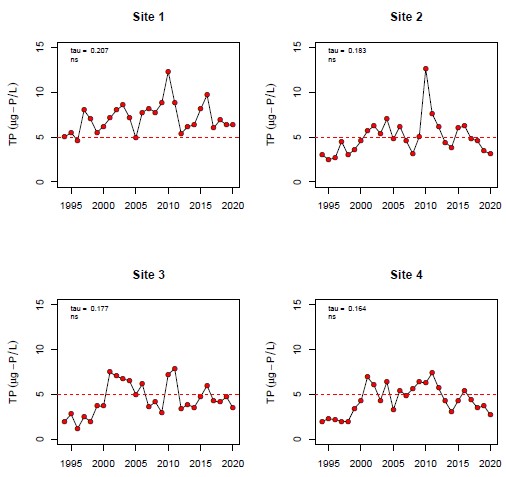
Figure 6. Median summer near-surface total phosphorus concentrations at each sampling site from 1994 – 2020 (Strecker et al., 2021).
• The decline in dissolved inorganic nitrogen (DIN) concentrations in the surface waters (16.5 foot depth) of basins 2 and 3 has accelerated over the last five years. By June, concentrations were below analytical detection limits for the first time since measurements have been taken (see Figure 7).
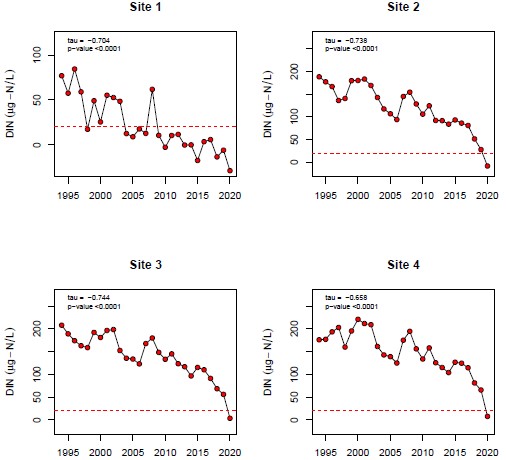
Figure 7. Minimum summer near-surface dissolved inorganic nitrogen (DIN) concentrations at each sampling site from (June – October) 1994 – 2020 (Strecker et al., 2021).
Basin 1, the most biologically productive subbasin of the lake, has had no DIN in its surface waters by June since 2009, indicating that basins 2 and 3 are on the same trajectory of increased biological productivity as in basin 1.
• The rate of dissolved oxygen (DO) depletion from the bottom waters of basins 1 and 2, as well as in the north end of basin 3 during the summer months, continues to increase. By August, DO concentrations in basins 1, 2, and the north end of basin 3 were 0 mg/L, 0 mg/L, and ~ 6 mg/L, respectively. For comparison, surface water DO in all three basins usually ranges from 9 to 10 mg/L in the summer. That equates to a loss of all DO in millions of gallons of water extending from 40 feet deep to the bottom of basins 1 and 2 in just a few months, resulting in “dead zones.” When summers are warmer, the rate of loss of DO in the bottom waters is accelerated.
• Thirty years ago, the lake was not as biologically active: for comparison in 1988, the DO at 14 meters deep (46.9 feet) in basin 1 in July was 5.5 mg/L (3.5 mg DO/L higher than 2020 levels) and by August at about 2.5 mg/L (2.5 mg/L higher) (see Figure 9).

Figure 9. Trends in dissolved oxygen over time in basin 1 at 14 meters (~46 feet) sampled in July, August, and September from 1988 through 2020 (Strecker et al., 2021).
• Most aquatic organisms require at least 2 mg. DO/L to survive. The only organisms capable of surviving unoxygenated conditions are certain types of bacteria and other microorganisms that decompose organic matter to obtain energy (carbon) and oxygen.
• As more nutrients have entered the lake and caused increased biological productivity, the amount of organic matter has accumulated in the sediments of each of the basins. This, in turn, has provided more food for the bacteria and they have increased in numbers, accelerating the rate at which dissolved oxygen is removed from the thermally isolated bottom waters during the summer.
• Total trihalomethanes (THMs), created during the disinfection process of water treatment, continue to decrease in tap water. This is most likely due to the installation of the Dissolved Air Floatation pretreatment system by the city of Bellingham in October of 2018. It removes particles from the raw lake water before it is treated at the city’s Whatcom Falls Water Treatment Plant and distributed to the public. Current THM levels from January through December of 2020 averaged about 0.03 mg/L, well below the contaminant maximum action level of 0.08 mg/L.
A Gamble
At the recent Lake Whatcom Joint Councils and Commissions virtual meeting held on March 31, 2021, general optimism was expressed that the TMDL target will be reached by 2066. Their reasoning is that human ingenuity will create better engineering and technologies over the next several decades, enabling greater efficiencies in removing phosphorus loadings from entering the lake. Hence, the steep slope of the dotted line on their graph they presented at the meeting (see Figure 1).
This confidence (or wishful thinking) is not based on facts and is counter to what usually happens. New technologies are usually subject to failures and take time to fully test and modify for optimal performances before implementation. Interestingly, there were others at the meeting who were not as confident and suggested that it is actually harder to achieve efficiencies over time because the easier fixes have already been implemented. Given the current activities still being allowed in the watershed and on the lake, there appears to be a game of political gambling with the future health of our drinking water source going on.
Where Do We Go From Here?
Back in 2006, Matthews et al. stated:
• If phosphorus loading is not stopped, the oxygen depletion in the lake will not stabilize.
• The single most important contributor to pollution in Lake Whatcom is stormwater runoff from residential development.
• Current water quality problems are from existing development.
• The lake cannot sustain the current level of development without increasing algal production.
• We need to limit the effects of new development and mitigate the effects of existing development.
Fifteen years have elapsed since then and we are faced with far worse water quality issues in Lake Whatcom and ongoing deterioration of our community’s drinking water source. The implications of having the quality of your entire drinking water source for more than 100,000 residents in Whatcom County continuing to deteriorate with each passing year doesn’t seem to elicit much alarm by our officials.
As long as we are “making progress to meeting the TMDL goal over the next 45 years,” there appear to be no repercussions or interventions from state and federal officials. In the meantime, more than 2,600 pounds of phosphorus are estimated to enter the lake this year, and the next, and the next. Time has run out and we need to take more aggressive action now, rather than depend on wishful thinking.
Take-Home Message
The Lake Whatcom Monitoring 2019/2020 Final Report data conveys, even more stridently, the three hard-earned messages I stated back in 2006: We must:
• Stop thinking we can build houses next to our drinking water source and that nothing bad will happen to the quality of our drinking water.
• Stop thinking we can “fix” anything we want, anytime we want if we throw enough money and technology at it.
• And, everything that happens in the Lake Whatcom watershed stays in the watershed and ends up, in some form, in the lake water, and eventually in your household tap water.
References
• Hood, S. 2016. Lake Whatcom Watershed Total Phosphorus and Bacteria Total Maximum Daily Loads: Volume 2. Water Quality Improvement Report and Implementation Strategy. Washington Department of Ecology Publication No. 13-10-012. Accessed 04/04/2019 at https://fortress.wa.gov/ecy/publications/summarypages/1310012.html.
• LWICT (Lake Whatcom Interjurisdictional Coordinating Team). 2021. 2020 Lake Whatcom Management Program Progress Report. Accessed 03/15/2021 at https://drive.google.com/file/d/1OiN_XGenb8hskvetbOG_UZaQWGFiNhiF/view?usp=sharing.
• LWJCC (Lake Whatcom Joint Councils and Commission). 2021. Lake Whatcom Management Program Annual Program Review. Presentation at the LWJCC meeting held on March 31, 2021. 76 pages. Accessed 04/02/2021 at https://drive.google.com/file/d/1hvj3PLDzeFd7iyy_hYaD3JVNcZ6rOMOY/view?usp=sharing.
• Matthews, R.A., M. Hilles, J. Vandersypen, R.J. Mitchell, and G.B. Matthews. 2006. Lake Whatcom Monitoring Project 2004/2005 Final Report. Prepared for the city of Bellingham, Bellingham, WA. March 30, 2006. 465 pages.
• Matthews, R.A., M. Hilles, J. Vandersypen, R.J. Mitchell, and G.B. Matthews. 2015. Lake Whatcom Monitoring Project 2013/2014 Report. Prepared for the city of Bellingham, Bellingham, WA. February 26, 2015. 339 pages.
• Strecker, A, M. Hilles, J. Pickens, R. Mitchell, R.A. Matthews, and G.B. Matthews. 2021. Lake Whatcom Monitoring Project 2019/2020 Report. Lake Whatcom Annual Reports. Accessible at: https://cedar.wwu.edu/lakewhat_annualreps/.
• Wetzel, R.G. 2001. Limnology: Lake and River Ecosystems, 3rd Edition. Elsevier Academic Press, San Diego, CA. 1006 pages.
__________________________
April Markiewicz is a toxicologist and recently retired as the associate director at the Institute of Environmental Toxicology at Huxley College of the Environment at Western Washington University. She is also the president of the People for Lake Whatcom Coalition.