by Eric Hirst
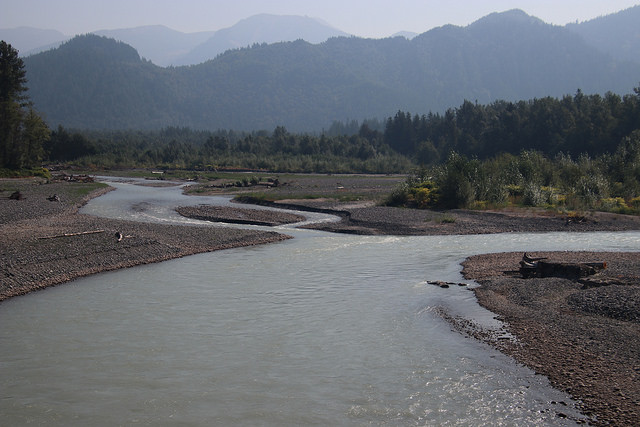
Confluence photo: Ron Kleinknecht
Streamflow Trends in the Nooksack River Basin
The Nooksack watershed provides water for salmon, other fish and wildlife. Its waters also support about 45,000 acres of irrigated farmland and 235,000 people and their homes, businesses, and industry. But supplies are limited, as evidenced by the poor state of salmon and the substantial amount of irrigated farmland that lacks legal access to water. Complicating this is the adverse effects of climate change.
This article documents changes in summer streamflows for five locations throughout the basin: mainstem Nooksack River at Ferndale; North, Middle and South Forks; and Fishtrap Creek. (1) Hopefully these five points provide a representative picture of flows throughout the basin.
I focus on summer (daily average flows for July, August, September) because that is when flows are lowest, salmon and other wildlife are most likely to need more water than is actually flowing, and human use of water is greatest (primarily agricultural irrigation). Low flows are a problem for wildlife and humans alike. In addition, low flows contribute to elevated water temperatures which, if high enough, can be lethal for fish. And low flows lead to reduced levels of dissolved oxygen, less habitat, and limited access to habitat, all of which are bad for fish.
Mainstem
Over the past 57 years (1967 – 2023) summer streamflow, measured by the U.S. Geological Survey in Ferndale, has been declining (Fig. 1). Over this period, flows decreased at an average of 0.6 percent per year. However, this adverse trend is accelerating: during the past 15 years (2009 through 2023), flows declined by 3 percent per year.
Nooksack River Summer Flows, cfs
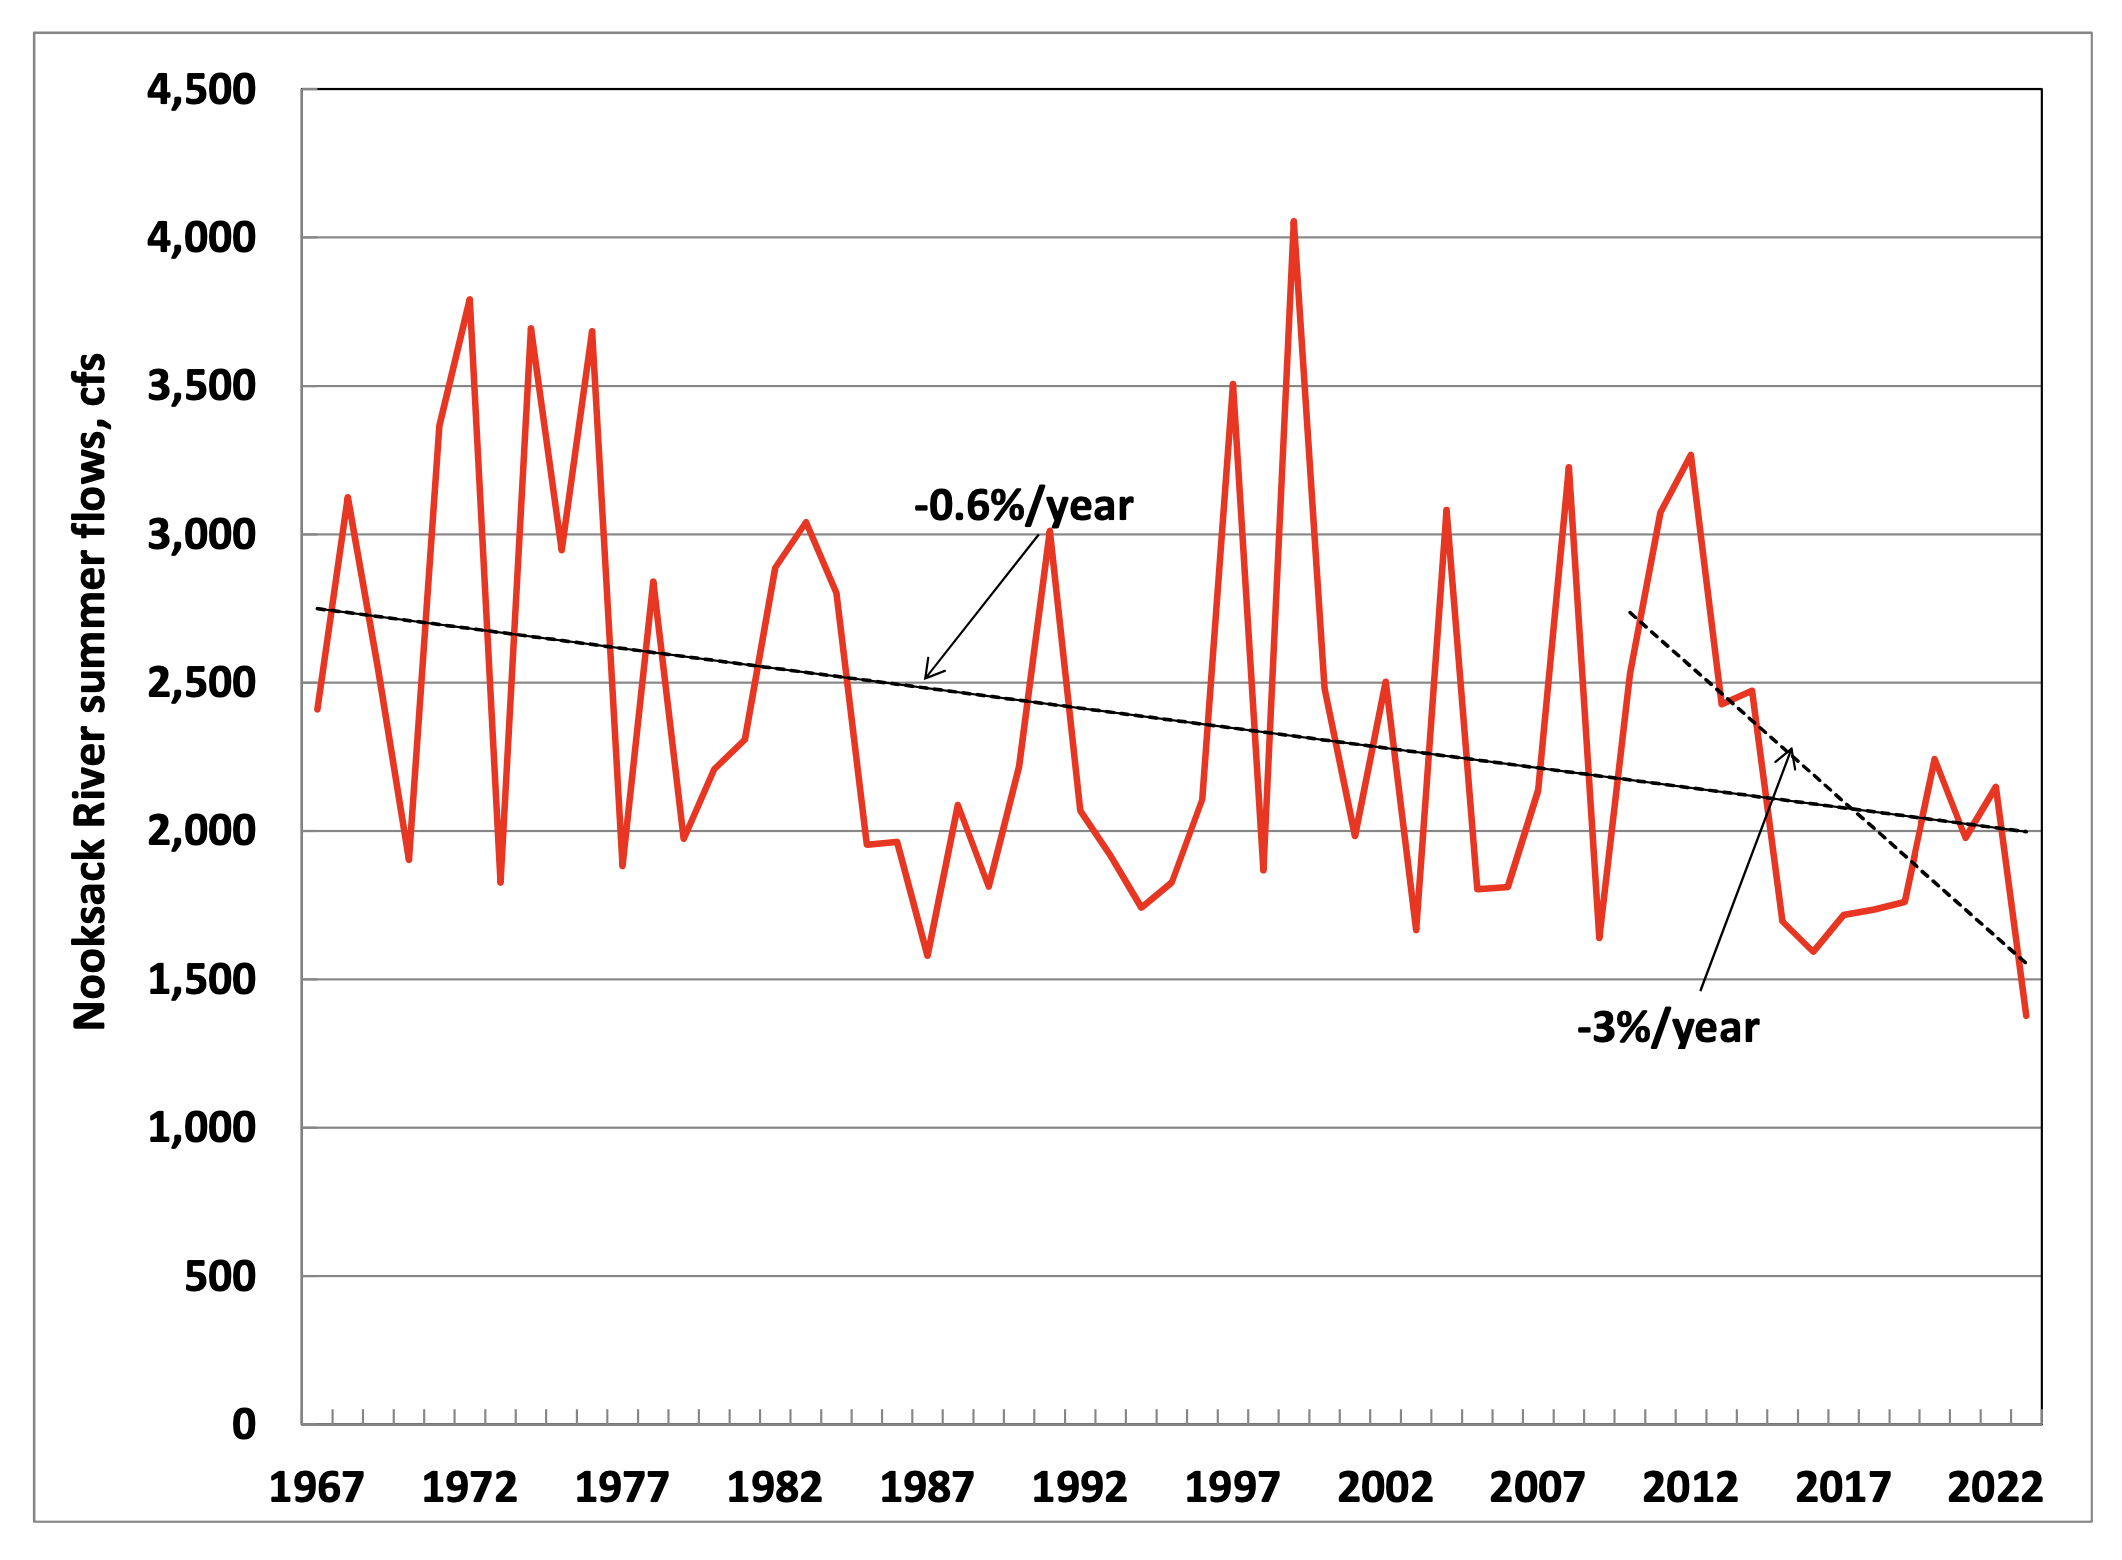
Figure 1
North Fork
Over the same period, flows in the North Fork, measured at Glacier, show the same pattern as for the mainstem: considerable year-to-year volatility and an overall decline (Fig. 2). Flows on the North Fork declined by 0.4 percent per year over the 57-year period and declined by 5 percent per year over the past 15 years.
North Fork Nooksack River Summer Flows, cfs
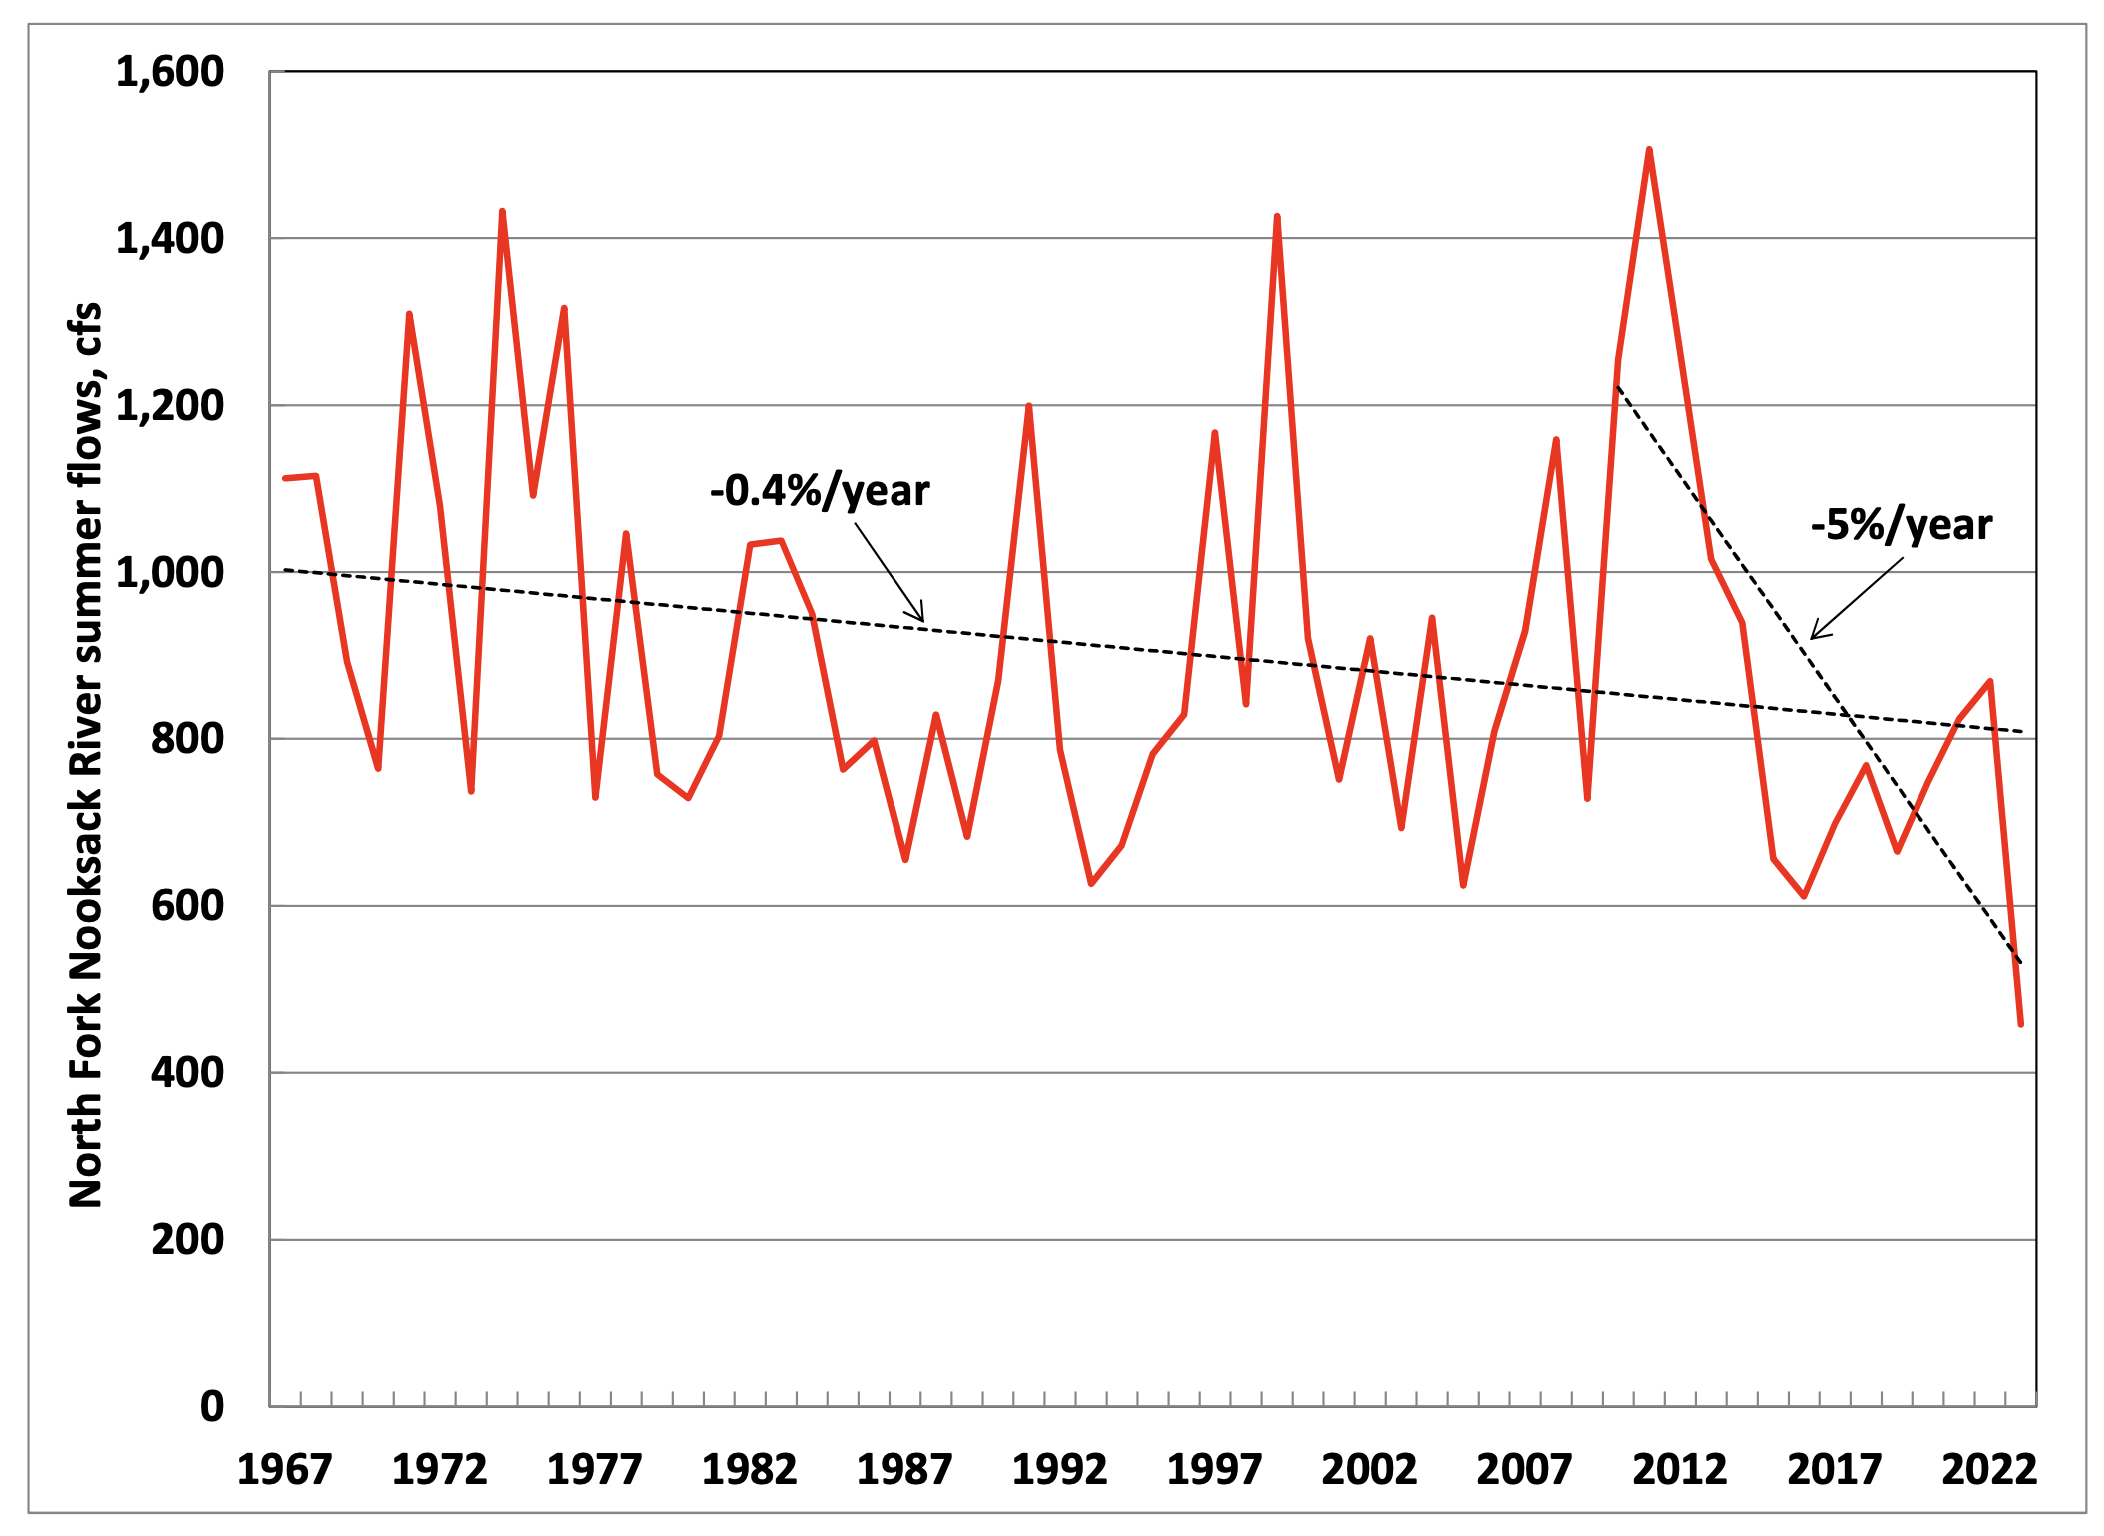
Figure 2
Middle Fork
Data for the Middle Fork, measured at Deming, are missing for two decades, from 1971 through 1991. Therefore, the results presented here are for the 32-year period from 1992 to 2023. Unlike the mainstem and other forks, the trend here is upward. That is, flows increased by 0.2 percent per year (Fig. 3). However, flows declined over the past 15 years at 3 percent per year.
Middle Fork Nooksack River Summer Flows, cfs
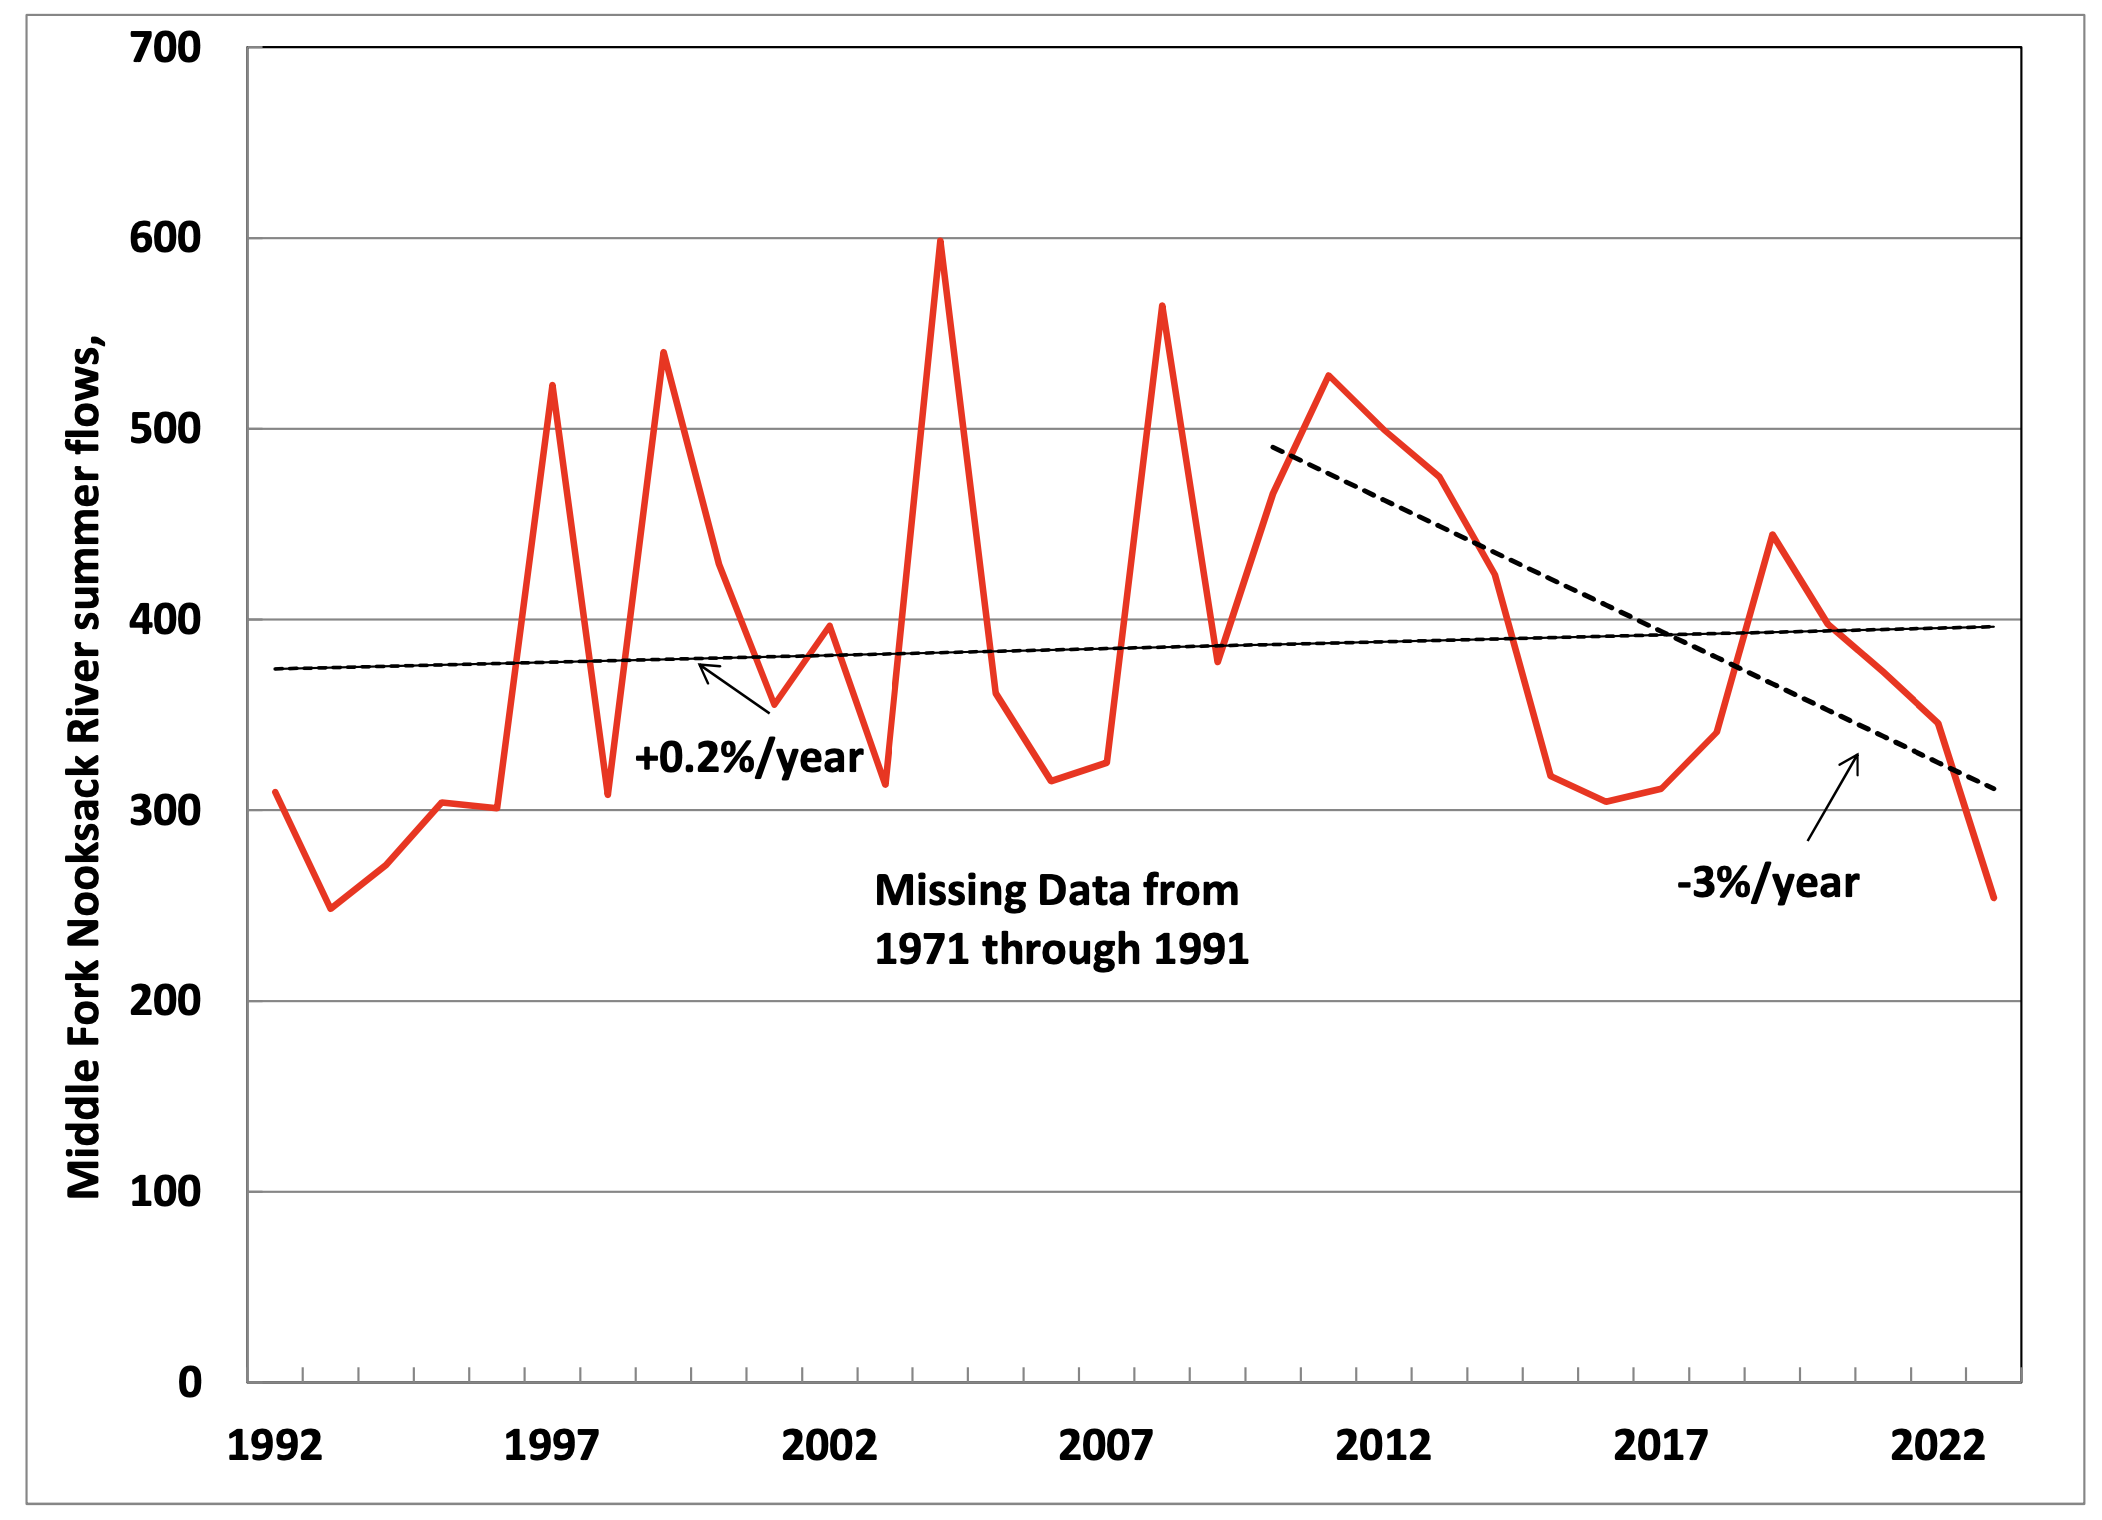
Figure 3
South Fork
Data for the South Fork, measured at the Saxon Bridge, are available only from 2009 through 2023, too short a period to draw meaningful conclusions on flow trends (Fig. 4). (2) From 2009 through 2023, flows declined at 5 percent per year.
South Fork Nooksack River Summer Flows, cfs
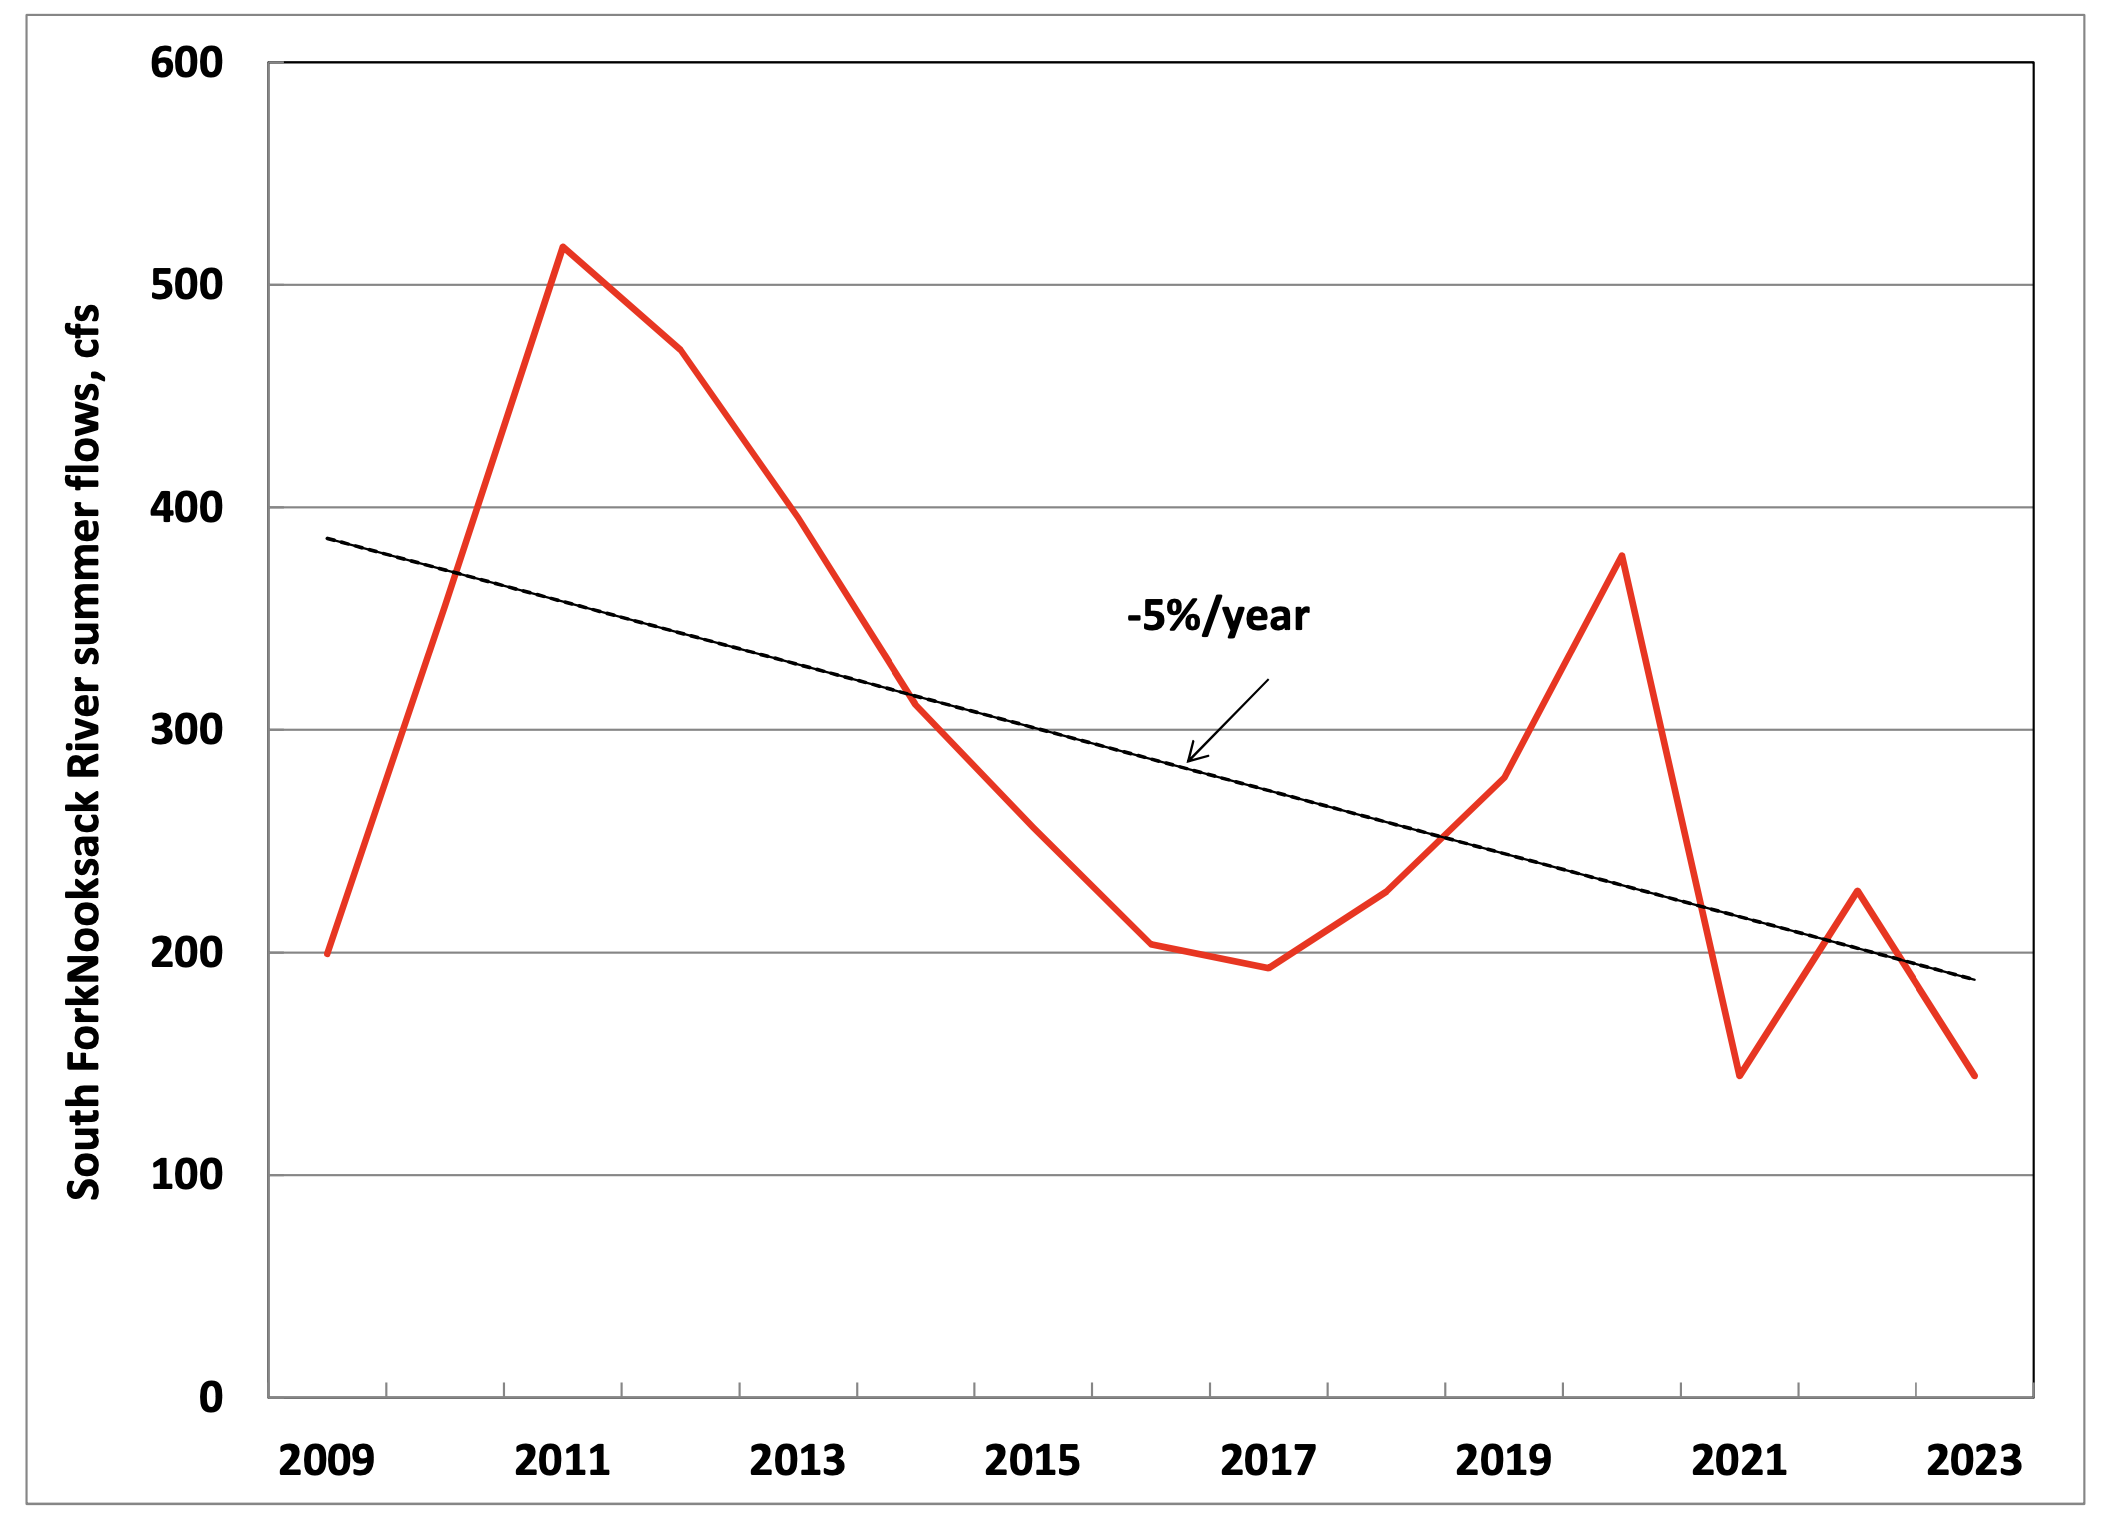
Figure 4
Fishtrap Creek
Data for Fishtrap Creek, measured in Lynden, are available from 1999 through 2023, 25 years. Over this period, flows declined at an average of 2 percent per year (Fig. 5); over the past 15 years, flows declined at 7 percent per year.
Fishtrap Creek Summer Flows, cfs
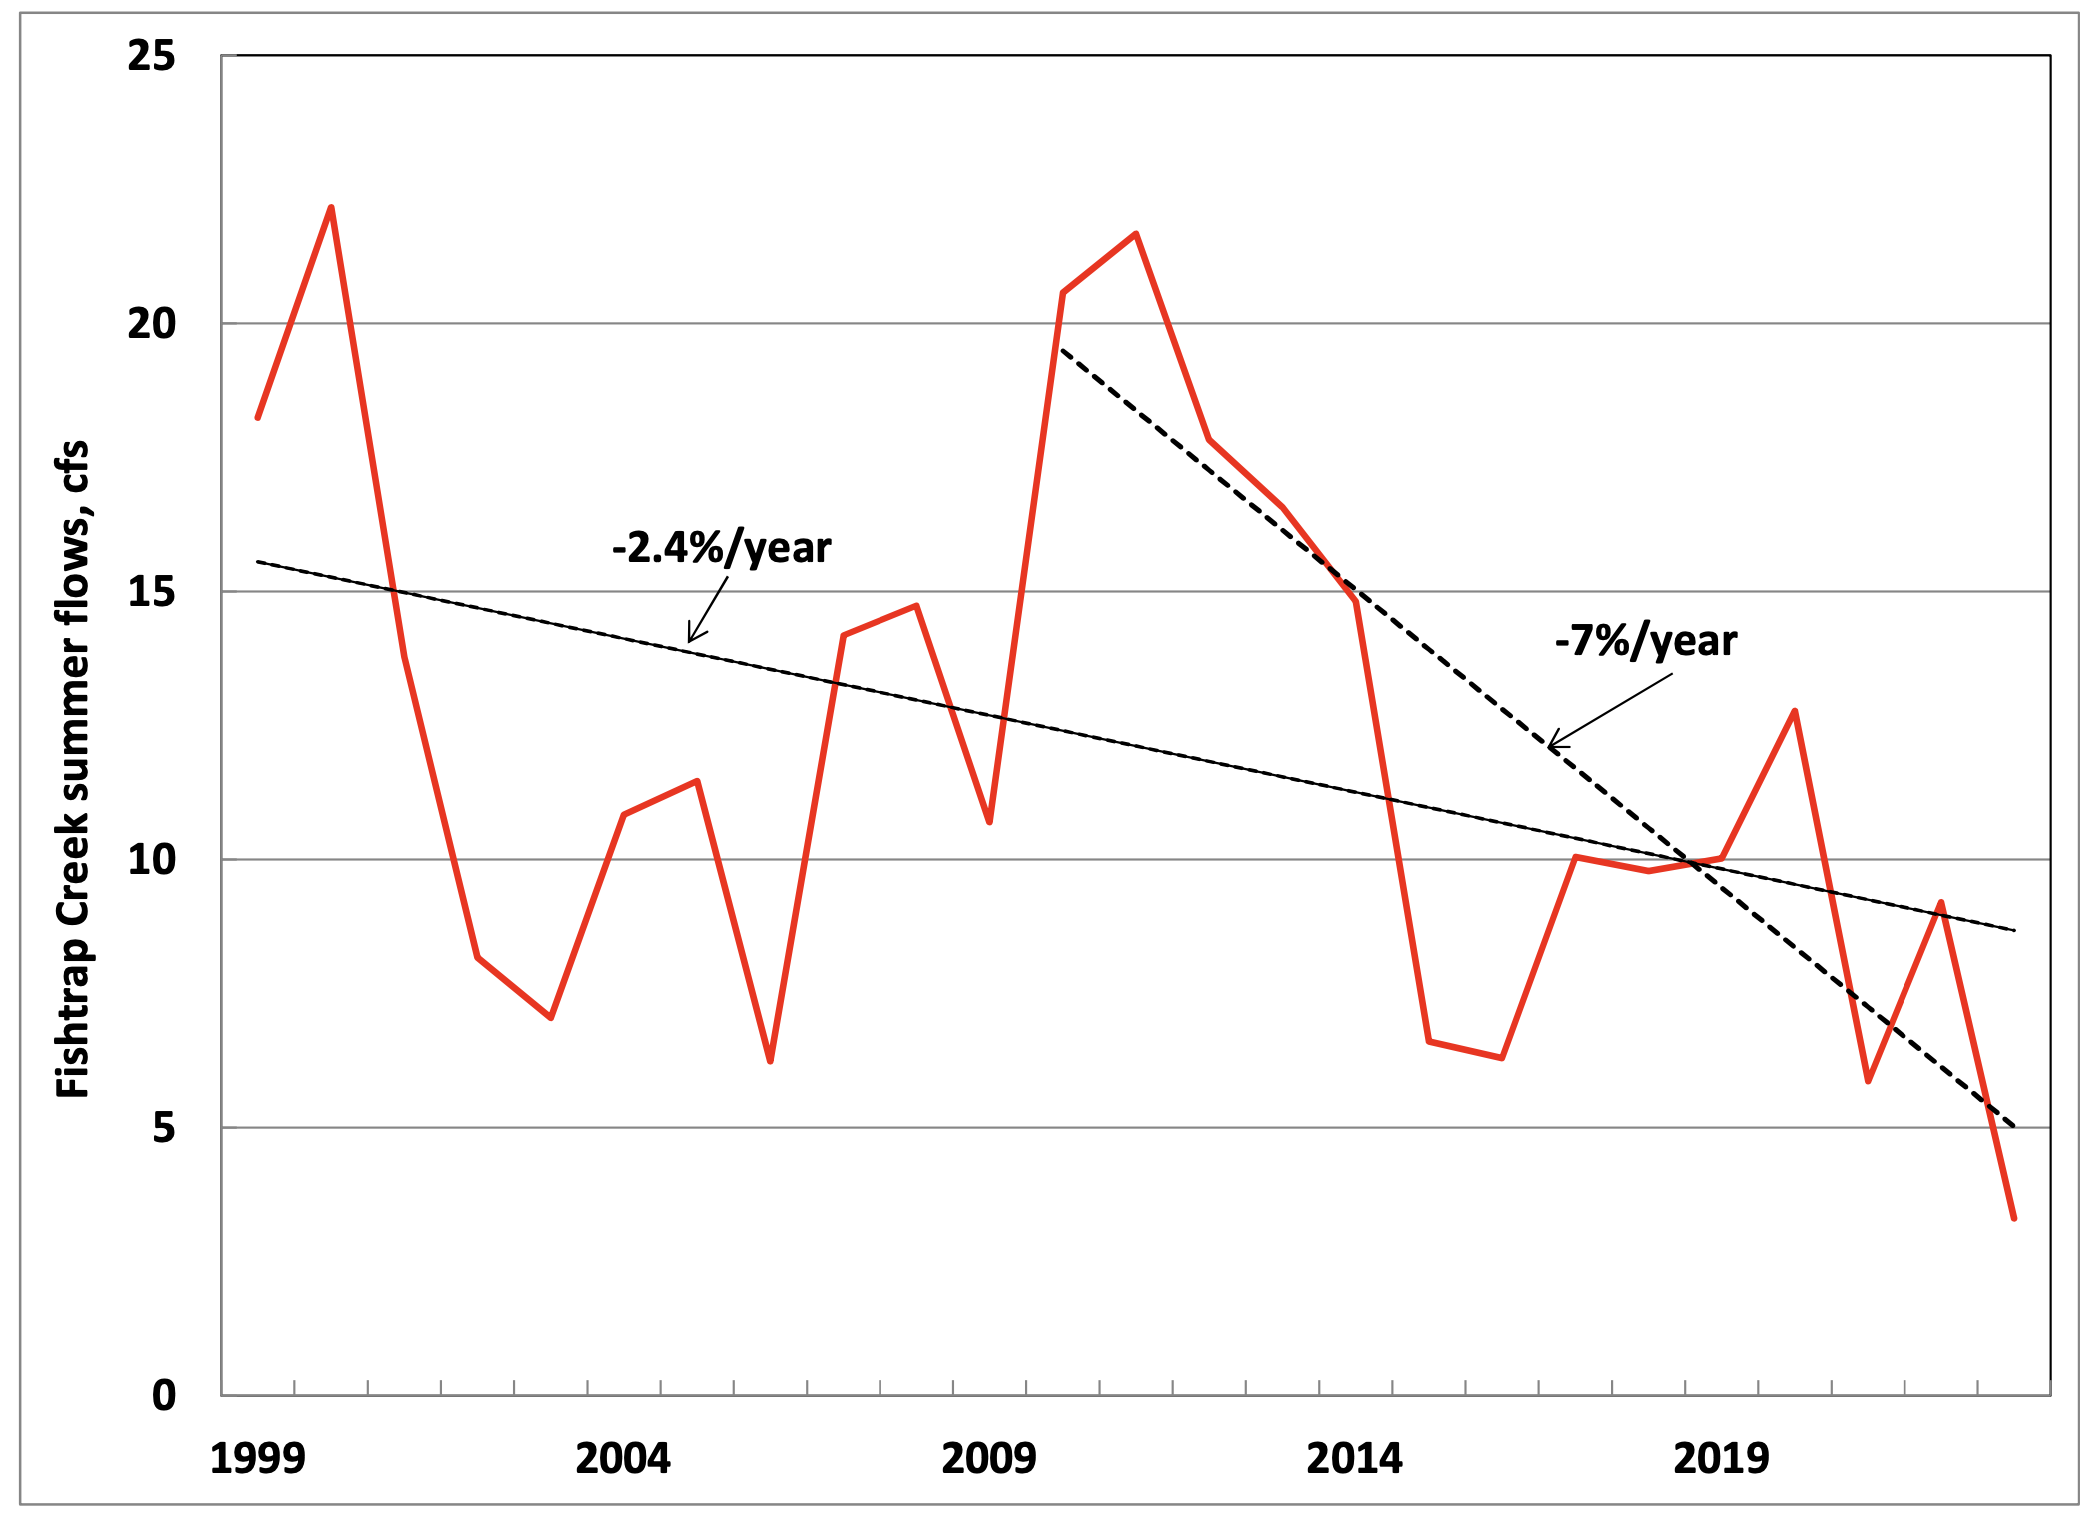
Figure 5
The Future
What can we expect in the future? According to the Tribal Climate Tool, flows in the Nooksack River are expected to be lower than current flows (which are already much lower than historical) by about 20 percent in the 2050s. (3) Analysis from Western Washington University suggests mid-2050s flows lower by 35 to 40 percent throughout the basin. (4)
To make matters worse, summer temperatures are expected to increase substantially over the next few decades, and summer precipitation is expected to decline, leading to greater use of water for irrigation. (5)
Summary
• Overall, summer flows on the mainstem, three forks and one lower Nooksack tributary are declining, although erratically and at different rates.
• These declines are worsening over time. Flows during the past 15 years declined much more rapidly — 5 to 10 times as fast — than during earlier years.
Is Time Running Out?
Yes, time is running out. This paper focuses on temporal changes in streamflow and does not address the causes of these declines. However, I believe the historical data and forecasts show clearly that climate change is a major contributor to the worsening decline in streamflows throughout the Nooksack River basin.
If flows throughout the Nooksack decline by 2 percent per year (less than half the recent decline shown here), flows will be lower by 18 percent in 10 years and by 33 percent in 20 years. (Don’t take these estimates literally. Extrapolating a straight-line fit to these “noisy” data would eventually show negative flows in the river.) Thus, we need to increase flows throughout the Nooksack basin — and do so quickly.
For over two decades, we have conducted countless meetings among many groups, produced report after report, and implemented a variety of projects that marginally improved our water supply-demand situation. But we have yet to adopt an action plan that includes specific projects to address these water-resource issues, including new supply, storage, and efficiency projects. In particular, we have consistently ignored the potential benefits (and costs) of water-use efficiency projects and programs.
Implementation would involve identification of specific problems in each basin (three forks, mainstem, and tributaries) and projects intended to resolve those problems. The plan would include budgets, funding sources, organizational responsibilities and accountability, and milestones. Although the 2018-2023 Implementation Strategy, (6) Regional Water Supply Planning Project, and Drainage-Based Management Project offered some promise, they have resulted in almost none of the elements necessary for basinwide success. (7)
Endnotes:
1. This paper is an update of one with the same title from two years ago, adding data from 2022 and 2023.
2. Streamflow data are available for Wickersham (about two miles away) through 2008. Lacking a reliable method to convert data from one gauge to another, I deal only with the recent data from Saxon Bridge.
3. https://climate.northwestknowledge.net/NWTOOLBOX/tribalProjections.php
4. E.A. Paul, Modeling 21st Century Peak Flows in the Nooksack River Basin in Northwestern Washington State Using Dynamically-Downscaled Global Climate Model Projections, Western Washington University, March 2023.
5. H. Morgan, Maps of Climate and Hydrologic Change for the Nooksack River Watershed, University of Washington Climate Impacts Group, Dec. 2017.
6. WRIA 1 Watershed Management Board, 2018-2023 Implementation Strategy, August 1, 2018, Approved updates 09/26/2019.
7. In particular, the Regional Water Supply Planning Project had four major limitations. Most important, the final report did not include an implementation plan to address the growing supply-demand imbalance throughout the various sub-basins.
Second, the project failed to include a single water-use efficiency project in any of the sub-basins.
Third, it failed to include any water-meter data in its development of a baseline on out-of-stream water uses, instead relying solely on estimates.
Finally, its forecasts of future water uses are inconsistent with the real world; the forecasts show substantial increases in water use, at variance with the historical record, which shows long-term declines in per capita water use.
___________________
Eric Hirst has a Ph.D. in engineering from Stanford University, worked at Oak Ridge National Laboratory for 30 years as a policy analyst on energy efficiency and the structure of the electricity industry. He has lived in Bellingham since 2002 and has worked on local water issues for almost a decade.