by Eric Hirst
The future of salmon in the Nooksack River watershed will be shaped by our prompt response to three realities:
- Climate change, including less snow, shrinking glaciers, earlierin- the-year snowmelt, higher summer temperatures, and less summer rain;
- Land-use practices, including forestry, farming, and urban development; and
- The actions to address droughts by our leaders do not match the urgency of the challenge. Implementing projects that increase summer water supplies, store winter water for summer use, and improve water-use efficiency is essential to preserve salmon in the Nooksack watershed.
This paper examines summer streamflows at five points: mainstem Nooksack at Ferndale, North Fork near Glacier, Middle Fork near Deming, South Fork at Saxon Bridge, and Fishtrap Creek at Lynden. These locations represent the major elements of the watershed. (1)
I focus on summer (daily average flows for July, August, September) because that is when flows are lowest, salmon and other wildlife are most likely to need more water than is actually flowing, and human use of water is greatest (primarily agricultural irrigation). Low flows are a problem for fish, other wildlife and humans. Low flows contribute to elevated water temperatures which, if high enough, can be lethal for fish. (2) And low flows lead to reduced levels of dissolved oxygen, less habitat, and limited access to habitat, all of which are bad for fish.
The only quantitative indicator of streamflows that healthy salmon populations need is the instream flow rule (ISF) that the state Department of Ecology (Ecology) issued in 1985, four decades ago. (3) Ecology’s rule is intended to:
retain perennial rivers, streams, and lakes in the Nooksack water resource inventory area with instream flows and levels necessary to provide for preservation of wildlife, fish, scenic, aesthetic, and other environmental values, and navigational values, as well as recreation and water quality.
The rule established minimum flows for 30 reaches within the basin. These minimums are specified for the 1st and 15th of each month, 24 values a year for each reach. The rule has no direct effect on instream flows; its only effect is to limit water use for more junior water-right holders when flows are too low.
Mainstem Nooksack
Over the past 59 years (1967 – 2025), summer streamflow, measured in cubic feet per second (cfs) in Ferndale, has been declining. Over this period, flows decreased at an average of 0.6 percent per year. Note the substantial year-to-year variability in flows, true for all five sites examined here.
Corresponding to the decline in streamflow, the fraction of days that actual flows meet or exceed the ISF rule declined during this six-decade period. At the beginning of the period, flows would have met the rule about half the time, whereas in the 2020s, flows met the rule only about 20 percent of the time, a decline of almost 2 percent per year. (4)
While the frequency of failure to meet the Ecology’s minimum flows is important, so too is the extent of the deficit. Missing the rule by a percent or two is not nearly as serious as missing by 20 percent. This deficit ranged from less than 20 percent during the first decade of this period to about 35 percent during the last decade.
The Other Four Sites
Data for these five locations are available for different time periods: 59 years for the mainstem and North Fork, 38 years for the Middle Fork, 17 years for the South Fork, and 27 years for Fishtrap Creek, respectively. Therefore, results for the latter two sites are less stable than for the other three locations.
Summer flows in four of the five locations declined during the periods for which data are available. For the Middle Fork, average summer flows showed a slight increase over the 38-year period for which data are available. (5)
Not surprisingly, compliance with Ecology’s rule declined in all locations except for the Middle Fork. The declines ranged from 1.5 to 9.4 percent per year; there was a very slight increase (0.3 percent per year) in compliance for the Middle Fork.
The trends for actual flows relative to Ecology’s minima on those days that flows were below the required minimum were similar: the deficit between actual and required grew for all locations except for the Middle Fork.
Fishtrap Creek presents a statistical challenge in this analysis. Compliance with the ISF rule is an astonishing 100 percent during the first two years for which data are available (1999 and 2000). Including these two years in the 27-year dataset suggests that compliance is improving over time. Excluding these two years shows the opposite.
Interpretation
Because of the substantial volatility in streamflows, it is not possible to draw unambiguous conclusions from this analysis. Nevertheless, here is what I see in these data.
Streamflows throughout the Nooksack basin declined substantially over the past few decades. As a consequence, compliance with Ecolog y’s instream flow rule, poor to begin with, also decreased substantially. This drop is illustrated by two statistics:
- Percentage of summer days that flows equal or exceed Ecology’s minimum values, and
- Percentage shortfall in actual flow relative to minimum values.
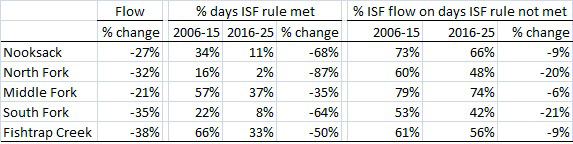
Table 1. Summary of Nooksack Summer Streamfow Results
Table 1 and Fig. 1 summarize these results by comparing data from the prior decade (2006 through 2015) to the latest decade (2016 through 2025), roughly from 2010 to 2020. Summer streamflows dropped by 21 to 38 percent across these five locations (including a 21 percent decline in the Middle Fork), an example of what Ecology called a “stunning loss of streamflow.” (6) As a consequence, the percentage of days that flows met the rule declined by 35 to 87 percent. And the actual flow relative to the required minimum fell by 6 to 21 percent. These substantial declines suggest further deterioration in the freshwater salmon environment.
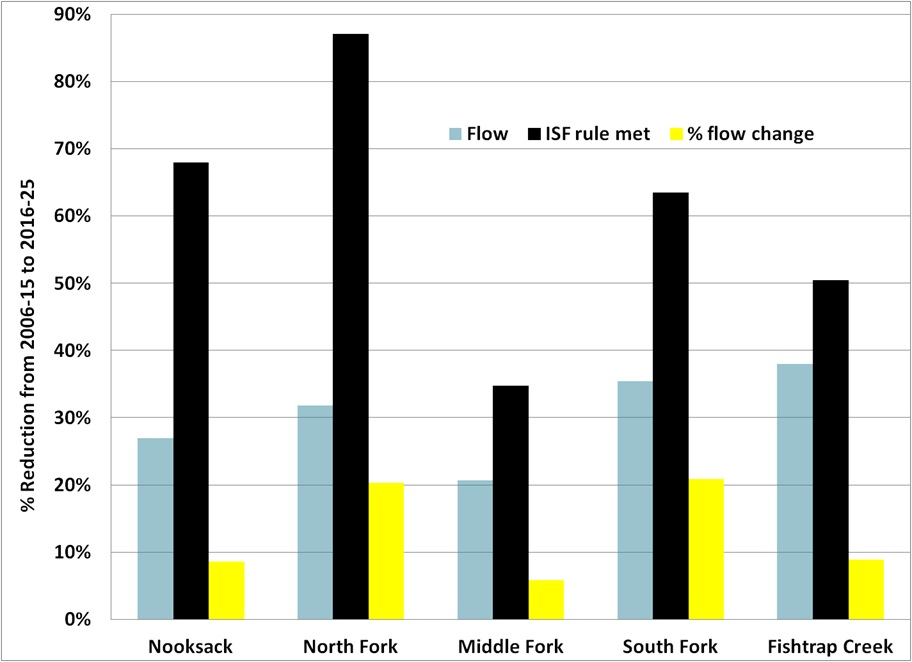
Fig. 1. Summary of Nooksack Streamflow Results
And what happens, as seems almost certain, if these adverse trends continue? (7) How much water will remain in the three forks, lowland tributaries and mainstem in 10 or 20 years? And what will that do to salmon health and numbers? And how much worse will fish be if we experience sequential (multiyear) droughts? (8)
Conclusion
Primarily because of climate change, streamflows throughout the Nooksack River Basin have been declining for several decades and are almost certain to continue going down for the next few decades. And low flows lead to low oxygen levels, high stream temperatures, less habitat, and less access to habitat, all of which adversely affect salmon health and populations.
If we want to restore salmon populations, we need to identify, analyze, and — most important — implement a robust set of water supply, storage, and efficiency projects and programs. Although staff and leadership at Ecology, Whatcom County, and the Watershed Management Board are dedicated and hardworking, implementation of projects and programs to restore flows is very limited.
Projects that would substantially increase flows, and also reduce winter flooding, are expensive. For example, a recent analysis of eight storage projects identified a wide range in capacity and costs (Fig. 2). (9) Unfortunately, the less expensive projects, in terms of $/acre-foot (af), would provide only modest amounts of summer water.
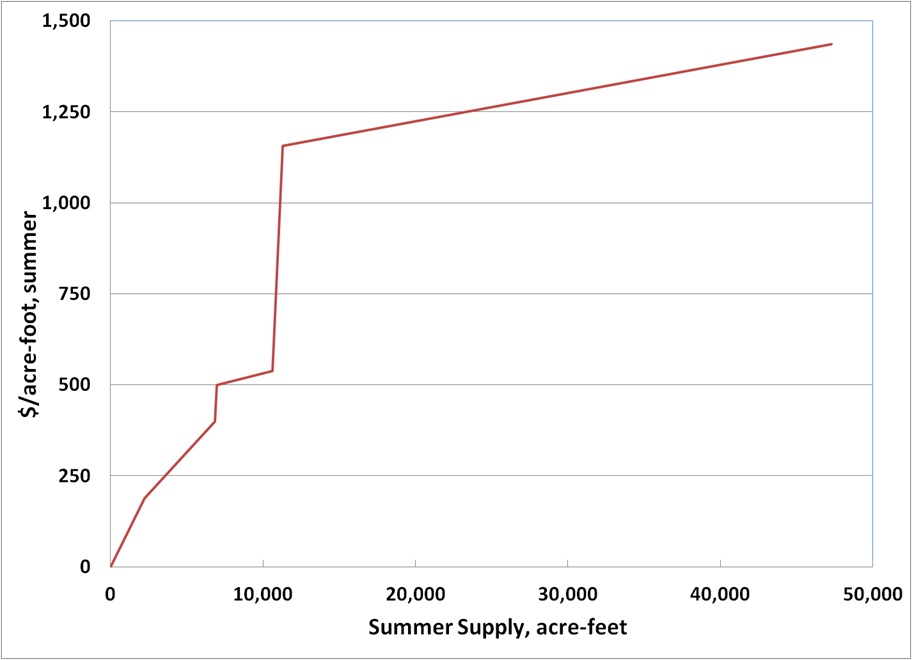
Fig. 2. Cost Curve for Water Storage Project in the Nooksack Watershed
This study identified two small projects in the South Fork, Springsteen Lake and Mustoe Marsh. Additional studies of these sites were conducted and another one is proposed for completion in 2027. (10) Whether these two projects will actually be constructed is unknown. Together, they might increase summer streamflow by 16 cfs during the summer months. This addition is only 6 percent of the actual South Fork flow and only slightly greater than the annual climate-induced decline in streamflow. And this 16 cfs increase is less than 1 percent of the mainstem summer flow.
At the other end of the cost spectrum, a dam on the North Fork might cost $2.6 billion to build plus $3.6 million per year to operate, and would provide a substantial 36,000 af of increased summer supply. This implies a cost of $1,440/af. Are we willing and able to pay this much for water? And where would the money come from? The federal, Washington state and local governments face serious structural budget problems. How many decades would it take to conduct the necessary engineering and environmental studies, obtain regulatory approvals, secure funding, hire contractors, construct the dam, and fill the reservoir? By that time, would summer flows be so low that salmon survival would be unlikely and the dam irrelevant?
Finding projects large enough to substantially offset the lowflow effects of climate change and also affordable is a challenge. That reality should not discourage action. Instead, it highlights the need to quickly implement low-cost projects while pursuing the larger investments required to restore long-term watershed resilience.
Prioritizing efforts where they can have the greatest impact raises important questions: Which tributaries and forks offer the greatest opportunity to improve salmon survival? Which projects provide the highest return on investment? Which salmon species and life stages would benefit most from targeted restoration? While declining summer flows and rising stream temperatures affect species and life stages differently, every population would benefit from improvements in water availability.
I hope this assessment is too pessimistic. To test that possibility, I asked a dozen colleagues to review a draft of this paper, focused on my concerns about the long-term outlook for Nooksack salmon. Every reviewer challenged my conclusion, which was encouraging. At the same time, with one exception, they did not identify specific projects that would change the trajectory described here.
Reviewers wrote:
-
- Salmon are a keystone species, both ecologically and culturally, in the Pacific Northwest. We owe it to ourselves to do everything we can to support salmon populations; however, if we try and do not succeed, it will not be a wasted effort.
- Salmon are resilient and adaptable. They will survive. Even if the probability of success is small, it is not zero. And extinction is not an option. We need to keep working on solutions.
- The more I learn about salmon recovery, the more complicated I see it is. So many good projects could be done if there were money and available land. The bureaucracy of bringing these projects to completion is unnecessarily arduous and creates an extended timeline that does not keep up with the immediate needs. However, progress is being made. With each project a new puzzle piece is added — and, at some point, they will connect and provide the continuity that salmon need. Water storage is on the forefront along with floodplain restoration and log-jam projects. The necessary work is slow, but it is moving forward. If we give up, how does this set the standard for all the young people who will carry this essential work forward?
One reviewer did offer specifics:
We need about 250,000 af of stored water to keep 1,500 cfs minimum flow by 2070 in worst current climate projections. Musto Marsh is about 2,000 af, and Springsteen Lake is about 650. Combined they are a start. Both are on the South Fork, where I think we will see the worst problems the earliest.
The 2070 forecast suggests that the mainstem will run dry for a couple of months, and, if the mainstem is dry, each of the forks is dry. If the forks are dry, each of the tributary streams is likely dry. That means that at the headwaters of each stream in the watershed that you want to save, you must have storage to allow for low-flow supplementation. This means you will want dozens of dams. If you get dozens in the 5,000 to 10,000 af range, it adds up to 250,000 af or more.
We need to start now on studies and soon (less than five years) on construction of the first. Then establish an annual cadence of construction. At the same time, we should aggressively pursue conservation, natural storage and aquifer recharge. Even though those actions together are a rounding error on what you need, they are quick, relatively cost effective, and the right thing to do.
My response to these suggestions:
The Anchor/QEA (11) findings have been available since 2023. Since then, efforts have focused on Mustoe Marsh and Springsteen Lake, with additional studies proposed before implementation can begin. While planning and science are essential, they cannot substitute for implementation. Climate change is not waiting for another report, funding cycle, or committee meeting. Every year we delay action allows the watershed to degrade further, making recovery more difficult and expensive. As we continue developing larger, long-term solutions, we must also move urgently on projects that can improve watershed resilience today.
The numerical results shown here are troubling. I hope we have not yet passed the point where recovery is no longer possible. Yet, we cannot ignore that possibility. Every year we delay meaningful action narrows the window for recovery. I hope the reviewers are right. But hope alone will not restore streamflows or recover salmon. We need to align around priority projects and move from planning to implementation with much greater urgency.
_________________________________
Eric Hirst has a Ph.D. in engineering from Stanford University, worked at Oak Ridge National Laboratory for 30 years as a policy analyst on energy efficiency and the structure of the electricity industry. He moved to Bellingham 23 years ago and remains active on local environmental issues.
References:
- E. Hirst, “Long Past Time to Act, Nooksack Watershed Summer Supply,” Whatcom Watch 35(6), June 2026.
- Higher air temperatures also affect water temperatures.
- Washington State Dept. of Ecology, Instream Resources Protection Program—Nooksack Water Resource Inventory Area (WRIA) 1, Chapter 173-501 WAC, June 9, 1988. See also Washington State Dept. of Ecology, Nooksack Instream Resource Protection Program (Water Resource Inventory Area 1), Nov. 1985. The rule was completed in late 1985 and went into effect in early 1986. The rule was amended in 1988.
- The rule’s flow levels were set at roughly the 50 percent exceedance levels (median flows); thus, the rule should be met, on average, about 50 percent of the days.
- This anomalous increase is likely due to increased melt of the Deming Glacier during warmer summers, which is the major source of water for the Middle Fork.
- Ecology, Focus on: Climate Impacts on Washington’s Water, Pub. 26-11-011, June 2026.
- RH2 Engineering, Regional Water Supply Plan – Phase 2 Report, Jan. 2023. See also R. Murphy, Modeling the Effects of Forecasted Climate Change and Glacier Recession on Streamflow in the Nooksack River, Geology Dept., Western Washington University, MS Thesis, Feb. 2016.
- According to the Washington Dept. of Fish and Wildlife, “Even a single dry year may harm [salmon] populations for several years, as an affected cohort moves through subsequent life stages. Multiple years of sequential drought have the potential to compound these impacts and cause irreparable damage: a population that is resilient to a year of low flows may face extirpation from prolonged drought;” from Ecology, Columbia River Basin Long-Term Water Supply & Demand Forecast, Draft, Office of Columbia River, Pub. 26-12-009, July 2026.
- Anchor QEA, Water Storage Alternatives Report, July 2024.
- Whatcom County, “WRIA 1 Storage Feasibility, Analysis and Selection,” Public Works Dept., March 2026.
- [Anchor QEA provides environmental science and engineering services]