Nooksack Watershed Summer Supply
by Eric Hirst
Am I an alarmist, falsely crying wolf ? Or are our summer drought problems about to become a crisis? Here is what the data show.
I’ve been studying summer water supply and demand issues in the Nooksack watershed for over a decade. Periodically, I analyze data from U.S. Geological Survey and Washington Dept. of Ecology (Ecology) streamflow gauges at five locations: (1)
- Mainstem Nooksack at Ferndale,
- North Fork near Glacier,
- Middle Fork near Deming,
- South Fork at Saxon Bridge, and
- Fishtrap Creek in Lynden.
Averaged over the past several decades, flows have been declining slowly, generally less than 1 percent per year. However, the past 15 years (2011 – 2025) yield a much gloomier picture: flows are now declining at 3 – 6 percent per year, much more rapidly than before.
We’ve known since Ecology established its instream flow rule in 1985 that summer flows were often too low to support healthy salmon populations. And now the situation has gotten worse — much worse.
History
I focus on summer (daily average flows for July, August, September) because that is when flows are lowest, salmon and other wildlife are most likely to need more water than is actually flowing, and human use of water is greatest (primarily agricultural irrigation). Low flows are a problem for wildlife and humans alike. In addition, low flows contribute to elevated water temperatures, which, if high enough, can be lethal for fish. And low flows lead to reduced levels of dissolved oxygen, less habitat, and limited access to habitat, all of which are bad for fish.
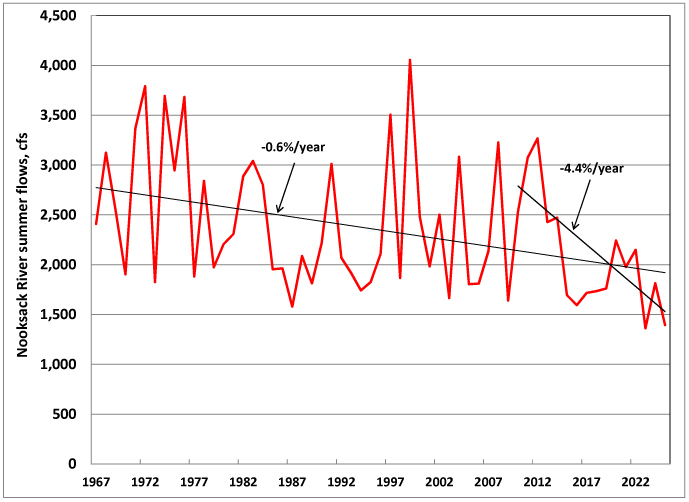
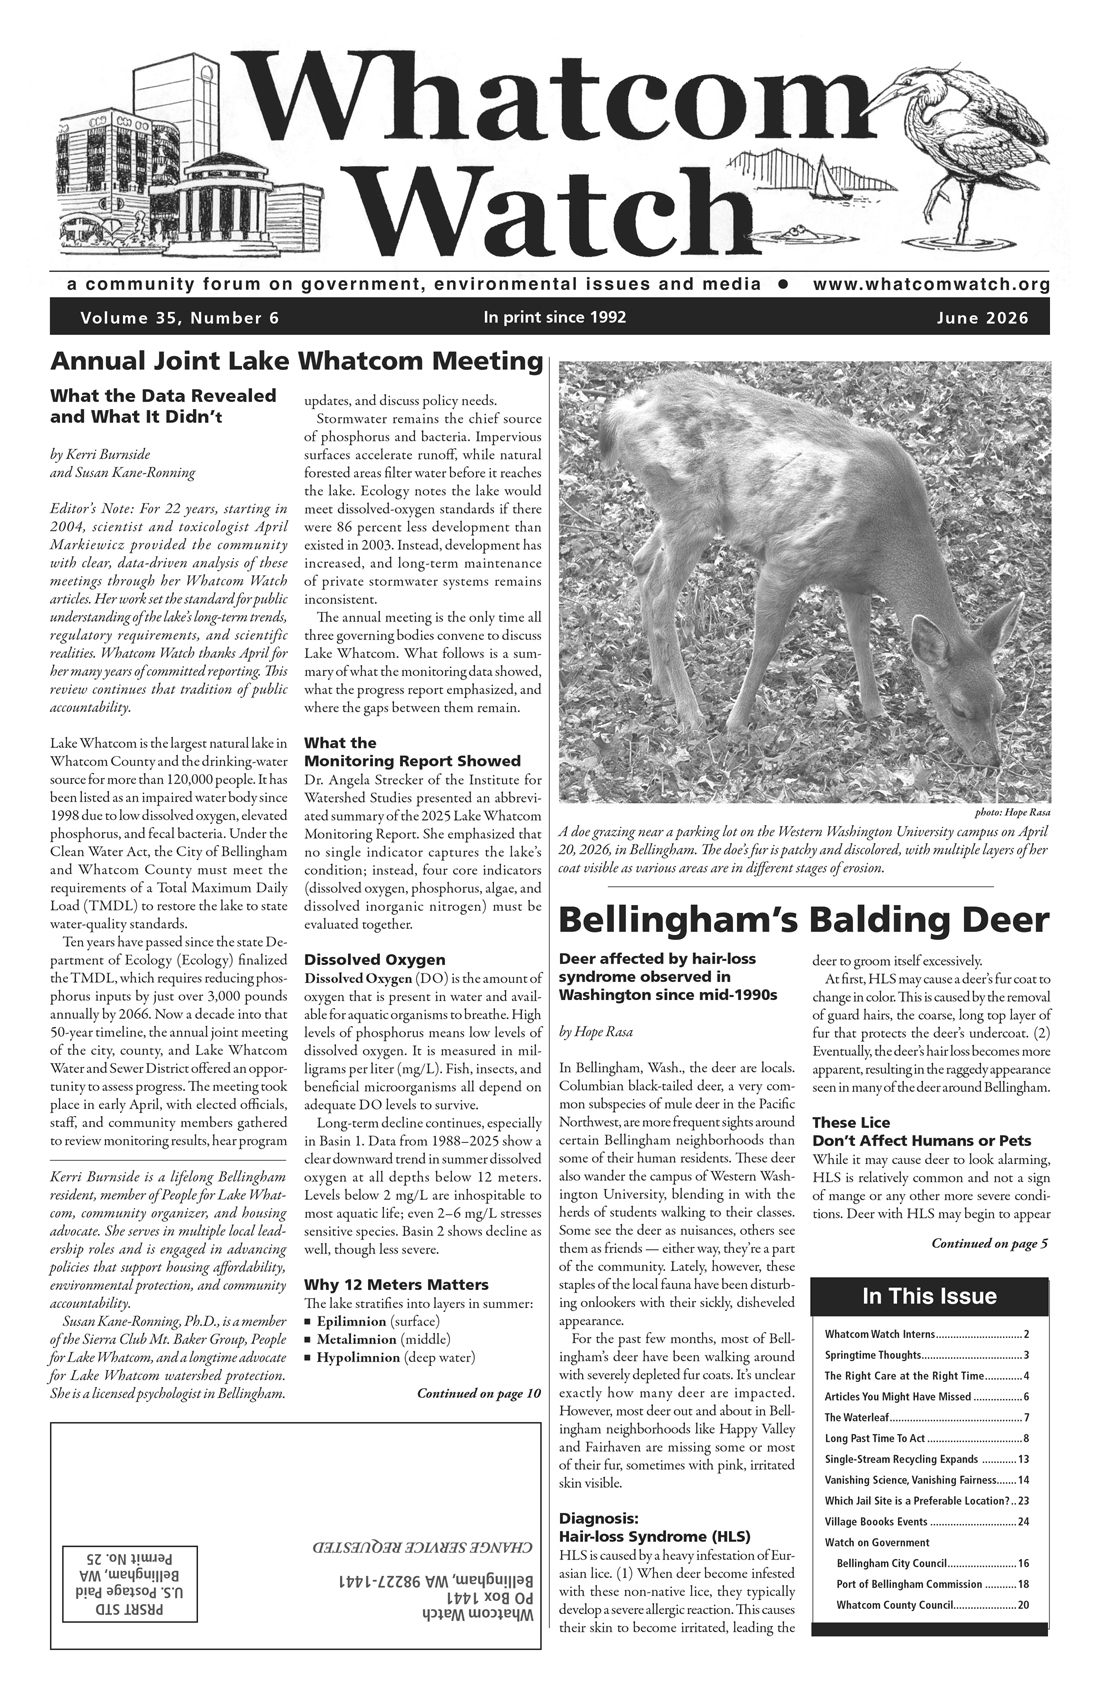
Figure 1. Nooksack River summer flows, cfs.
Mainstem: Over the past 59 years (1967 – 2025), summer streamflow, measured in cubic feet per second (cfs) by the U.S. Geological Survey in Ferndale, has been declining (Fig. 1). Over this period, flows decreased at an average of 0.6 percent per year. However, this adverse trend is accelerating : during the past 15 years (2011 through 2025), flows declined by 4.4 percent per year.
North Fork: Over the same period, flows in the North Fork, measured at Glacier, show the same pattern as for the mainstem: considerable year-to-year volatility and overall decline (Fig. 2). Flows on the North Fork declined by 0.4 percent per year over the 59-year period and by 5.1 percent per year over the past 15 years.
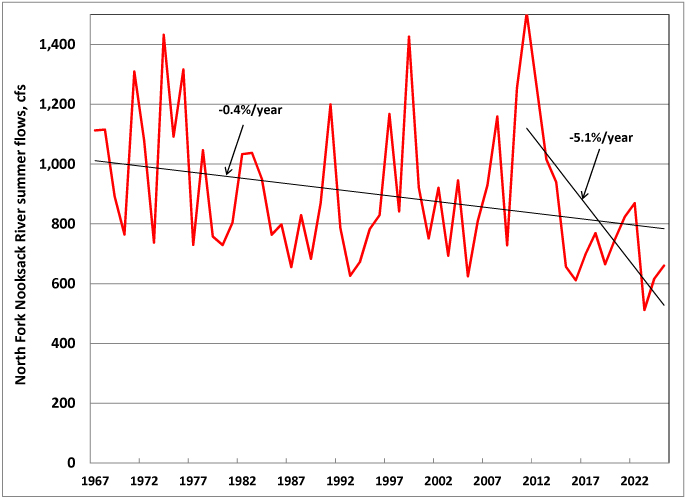
Figure 2. North Fork Nooksack River summer flows, cfs.
Middle Fork: Data for the Middle Fork, measured at Deming, are missing for two decades, from 1971 through 1991. Therefore, the results presented here are for the 34-year period from 1992 to 2025. Unlike the mainstem and other forks, the trend here is neutral. That is, flows changed by 0 percent per year (Fig. 3). However, flows declined over the past 15 years at 3.4 percent per year.
Figure 3. Middle Fork Nooksack River summer flows, cfs.
South Fork: Data for the South Fork, measured at Saxon Bridge, are available only from 2009 through 2025 (Fig. 4). During this period, flows declined at 6.4 percent per year.
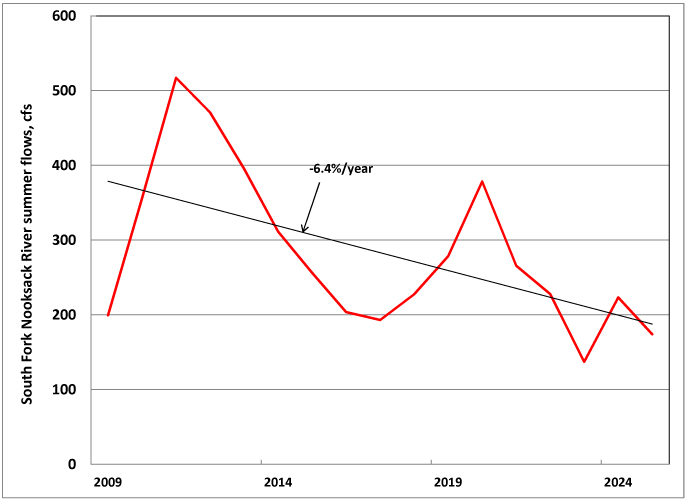
Figure 4. South Fork Nooksack River summer flows, cfs.
Fishtrap Creek: Data for Fishtrap Creek, measured in Lynden, are available from 1999 through 2025, 27 years. Over this period, flows declined at an average of 2 percent per year (Fig. 5); over the past 15 years, flows declined at 6.4 percent per year. (2)
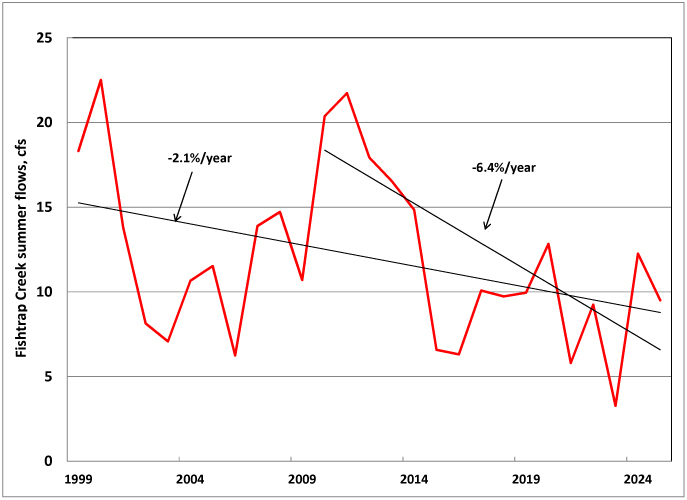
Figure 5. Fishtrap Creek summer flows, cfs.
Causes of Streamflow Declines
Several factors account for the long-term declines in streamflow shown above. These include: higher summer air temperatures, less summer rainfall, earlier-in-the-season snowmelt, and loss of glacier mass. For example, glaciers in the North Cascades (not just Mt. Baker) have lost almost 40 percent of their mass during the past four decades. (3)
The Nooksack Indian Tribe notes, “Some of the glaciers on Mount Baker have receded over 1,000 feet in the last 20 years. This represents a substantial reduction in ice volume. At present rates of glacier melting, several glaciers that feed the Nooksack River watershed may disappear completely. With current trends in the reduction of glaciers and predictions [of ] continued climate change, river flows in the mid- to late summer will be further reduced and temperatures will increase, creating even larger challenges to salmon survival.” (4)
Summary
Overall, summer flows on the mainstem, three forks and one lower Nooksack tributary are declining, although at different rates (Table 1).
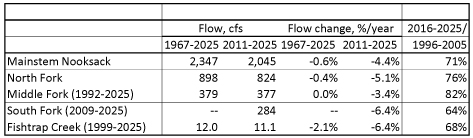
Summary of Nooksack River streamflow results.
- These declines are worsening over time. Flows during the past 15 years declined much more rapidly — 5 to 10 times as fast — than during earlier years.
- Flows declined by 20 to almost 40 percent over the last decade, from 2006-2015 to 2016-2025. If this trend continues, how will this affect salmon, other wildlife, and farms in 2035 and 2045?
- These declines are associated with several factors, including earlier spring snowmelt, declines in glacier mass, higher summer air temperatures (which increase evaporation from surface waters), and lower summer precipitation.
- Because of these changes, conditions for salmon (and other wildlife) have become worse and worse.
Conclusion
“Instream flow is the water flow within a river or stream required to maintain a healthy ecosystem, support wildlife, and sustain recreational and cultural activities. This is particularly vital to salmon who begin swimming back to their spawning grounds in late summer — when water levels can be fatally low.” (5)
Historical data show clearly that summer streamflows throughout the Nooksack River basin have been declining for years and will continue to do so in the future.
These historical and nearcertain future declines in water supply have major implications for local government and other leaders. Ecology, the Watershed Management Board, Whatcom County, Lummi Nation, Nooksack Indian Tribe, and others should be actively reducing summer demand and increasing summer flows. Unfortunately, almost none of that is happening.
The Watershed Management Board recently agreed to pursue funding for two small water storage projects on the South Fork: Mustoe Marsh and Springsteen Lake. However, there are no plans and projects for new water supplies (moving water from where it is abundant to where it is scarce) or for water use efficiency (a largely untapped local resource). Given the poor state of our salmon populations, I am baffled and troubled by this lack of urgency on the part of our leaders.
So, am I an alarmist? Or do we face serious summer water supply/ demand imbalances that are rapidly getting worse?
______________________
Eric Hirst has a Ph.D. in engineering from Stanford University, worked at Oak Ridge National Laboratory for 30 years as a policy analyst on energy efficiency and the structure of the electricity industry. He moved to Bellingham 23 years ago and remains active on local environmental issues.
Endnotes
- See, for example, E. Hirst, “Climate Change and the Nooksack Adjudication,” Whatcom Watch, June 2024.
- Flows in Fishtrap Creek, as well as in other lowland creeks, are also affected by flows south from British Columbia, which has seen substantial population growth in recent years.
- M. Pelto, “Disastrous Year for North Cascade Glacier Mass Balance (Snow/Ice Economy),” American Geophysical Union, Blogosphere, Aug. 20, 2015. Also personal communication with M. Pelto, Nichols College, Sept. 15, 2023.
- Environmental Studies Program, University of Oregon, Tribal Climate Change Profile: Nooksack Indian Tribe, July 2014.
- I. Simonelli, “Nooksack Basin residents prepare to define, defend water rights,” Cascadia Daily News, Apr. 4, 2024.